Free Access
Fig. 11
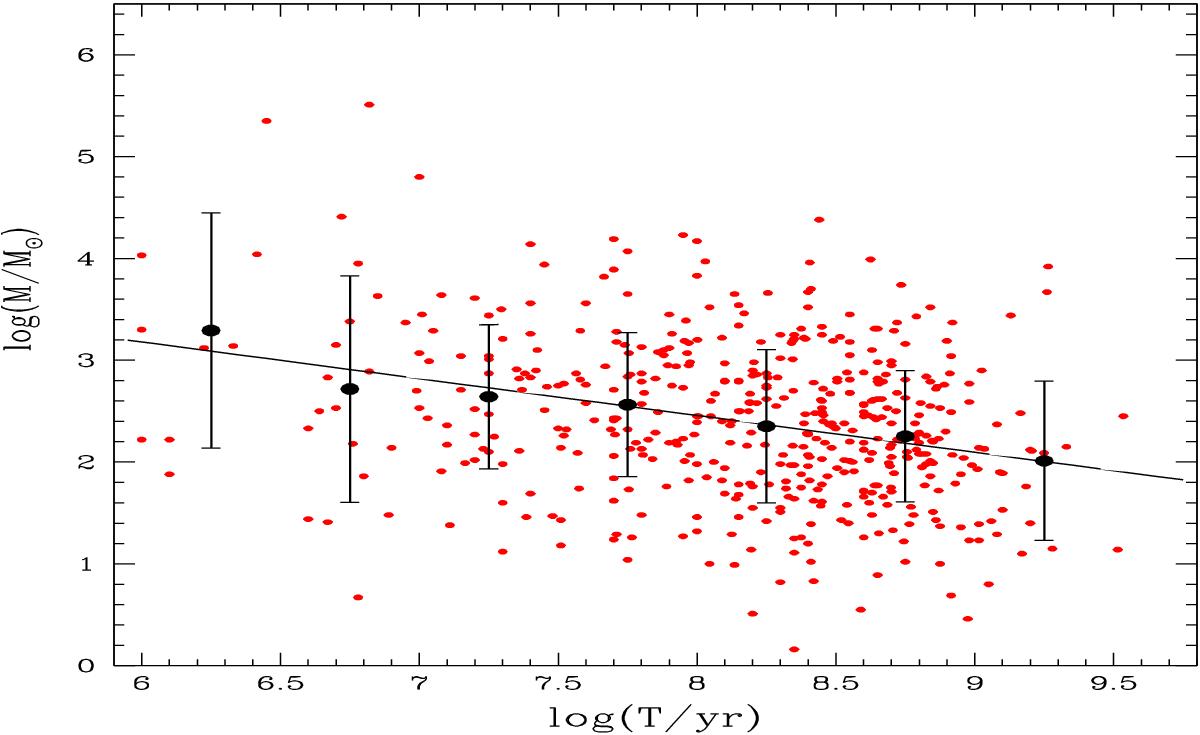
log-log relation between age and total mass of the clusters. The solid points are the mean value of log M in the interval of Δlog T = 0.5, while the error bars are the variance about the mean. A least-squares linear fit is also drawn as a continuous line.
Current usage metrics show cumulative count of Article Views (full-text article views including HTML views, PDF and ePub downloads, according to the available data) and Abstracts Views on Vision4Press platform.
Data correspond to usage on the plateform after 2015. The current usage metrics is available 48-96 hours after online publication and is updated daily on week days.
Initial download of the metrics may take a while.