Free Access
Fig. 12
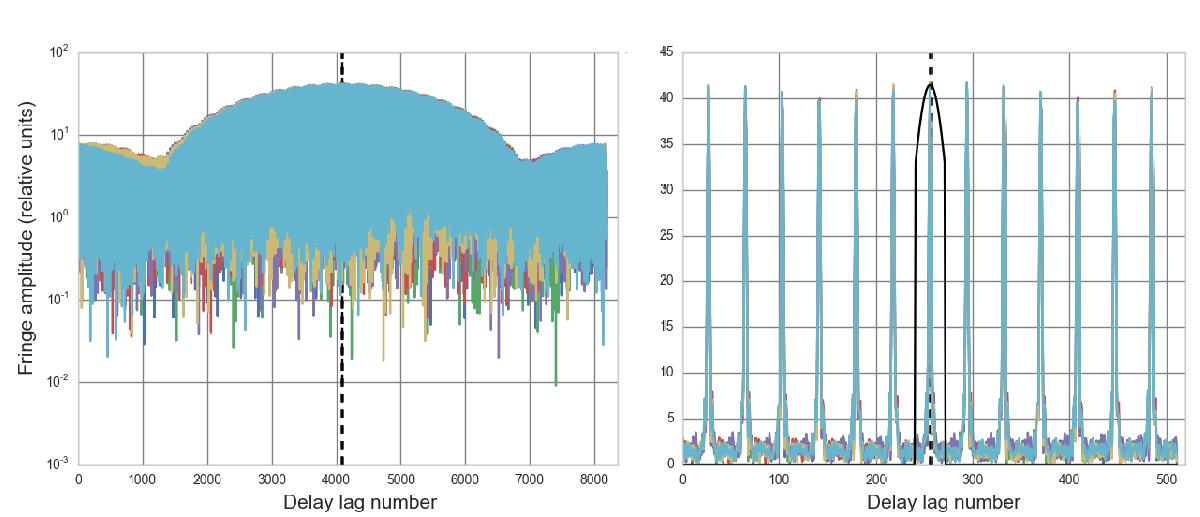
Spectrum compression from 4096 (left panel) down to 256 (right panel) spectral points, and filtration in lag domain. The solid black line in the right panel shows the output filter profile. One-second integrated spectra are shown. Scan 209, baseline T6-Sv. The dashed black lines denote the central lag.
Current usage metrics show cumulative count of Article Views (full-text article views including HTML views, PDF and ePub downloads, according to the available data) and Abstracts Views on Vision4Press platform.
Data correspond to usage on the plateform after 2015. The current usage metrics is available 48-96 hours after online publication and is updated daily on week days.
Initial download of the metrics may take a while.