Fig. 4
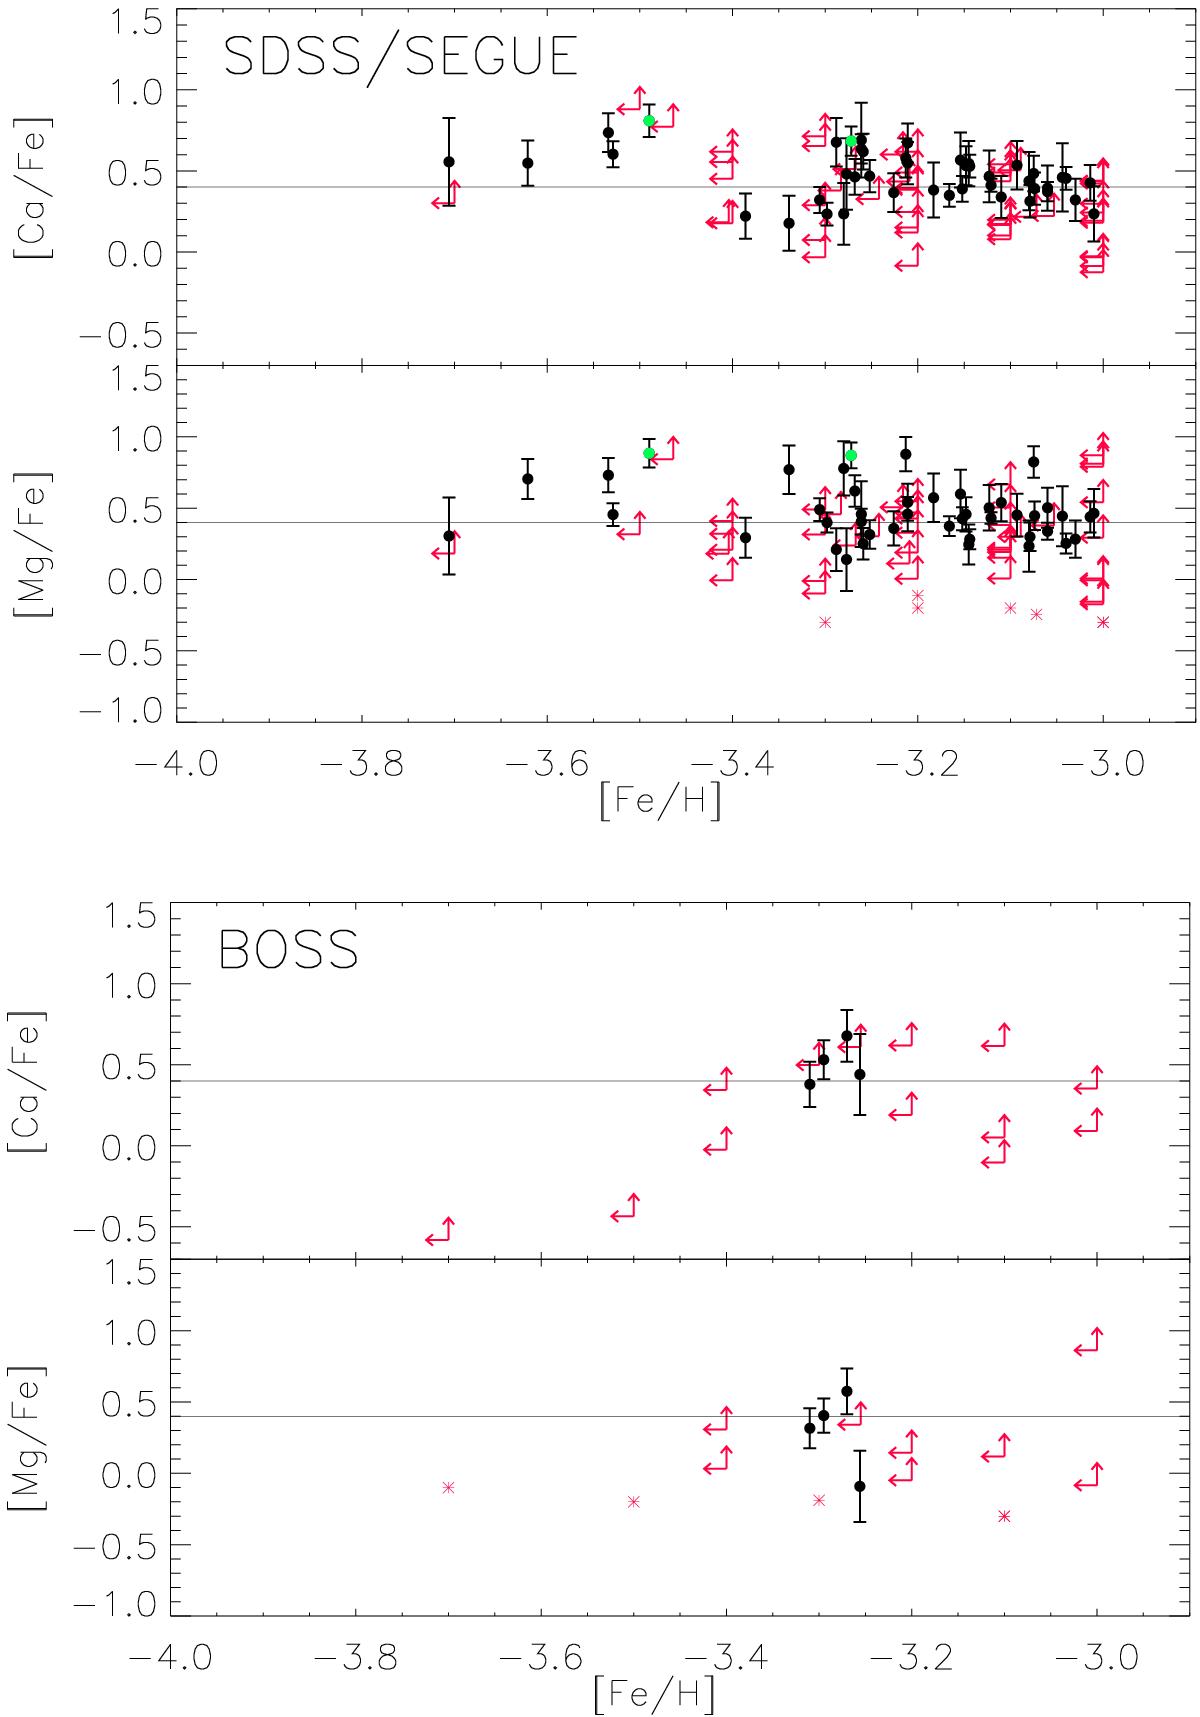
[Ca/Fe] and [Mg/Fe] ratios as a function of [Fe/H] from the analysis of our SDSS/SEGUE and BOSS samples. The reliable estimates after applying the upper limit evaluation are indicated as black dots. Red arrows show the cases where only an upper limit for the abundances could be obtained, and the direction the ratio would be situated in this diagram. The two stars for which we obtain high [Ca/Fe] and [Mg/Fe] are shown as green dots.
Current usage metrics show cumulative count of Article Views (full-text article views including HTML views, PDF and ePub downloads, according to the available data) and Abstracts Views on Vision4Press platform.
Data correspond to usage on the plateform after 2015. The current usage metrics is available 48-96 hours after online publication and is updated daily on week days.
Initial download of the metrics may take a while.