Fig. 2
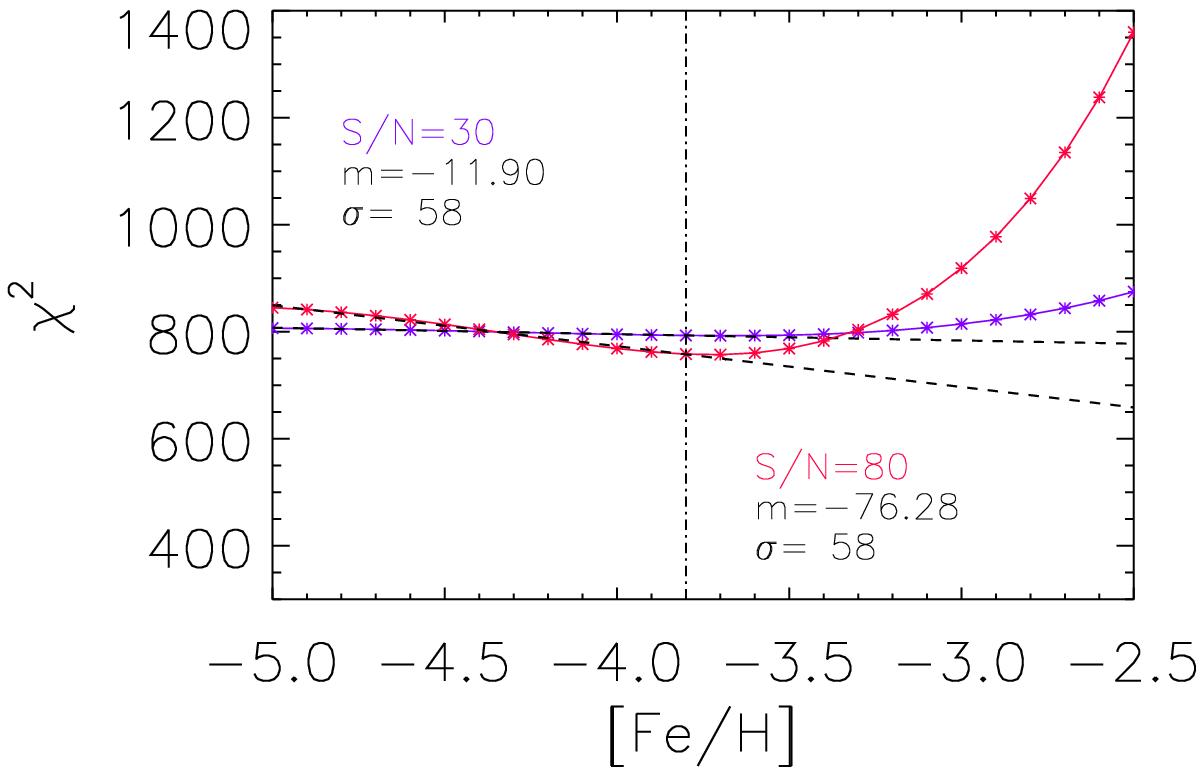
χ2 obtained from the evaluation of a simulated spectrum at [M/H]0= [Fe/H]0= −3.8 (marked with a vertical dotted line) compared with synthetic spectra over a range of metallicities [M/H] (from −5.0 to −2.5 with a step of 0.1 dex). The blue line shows the resulting χ2 curve for a simulation with S/N = 30, and the red line applies to S/N = 80. The two black dotted lines indicate the linear fits up to the [M/H]0 corresponding to the minimum χ2, from which the slope and its uncertainty are derived.
Current usage metrics show cumulative count of Article Views (full-text article views including HTML views, PDF and ePub downloads, according to the available data) and Abstracts Views on Vision4Press platform.
Data correspond to usage on the plateform after 2015. The current usage metrics is available 48-96 hours after online publication and is updated daily on week days.
Initial download of the metrics may take a while.