Free Access
Fig. 8
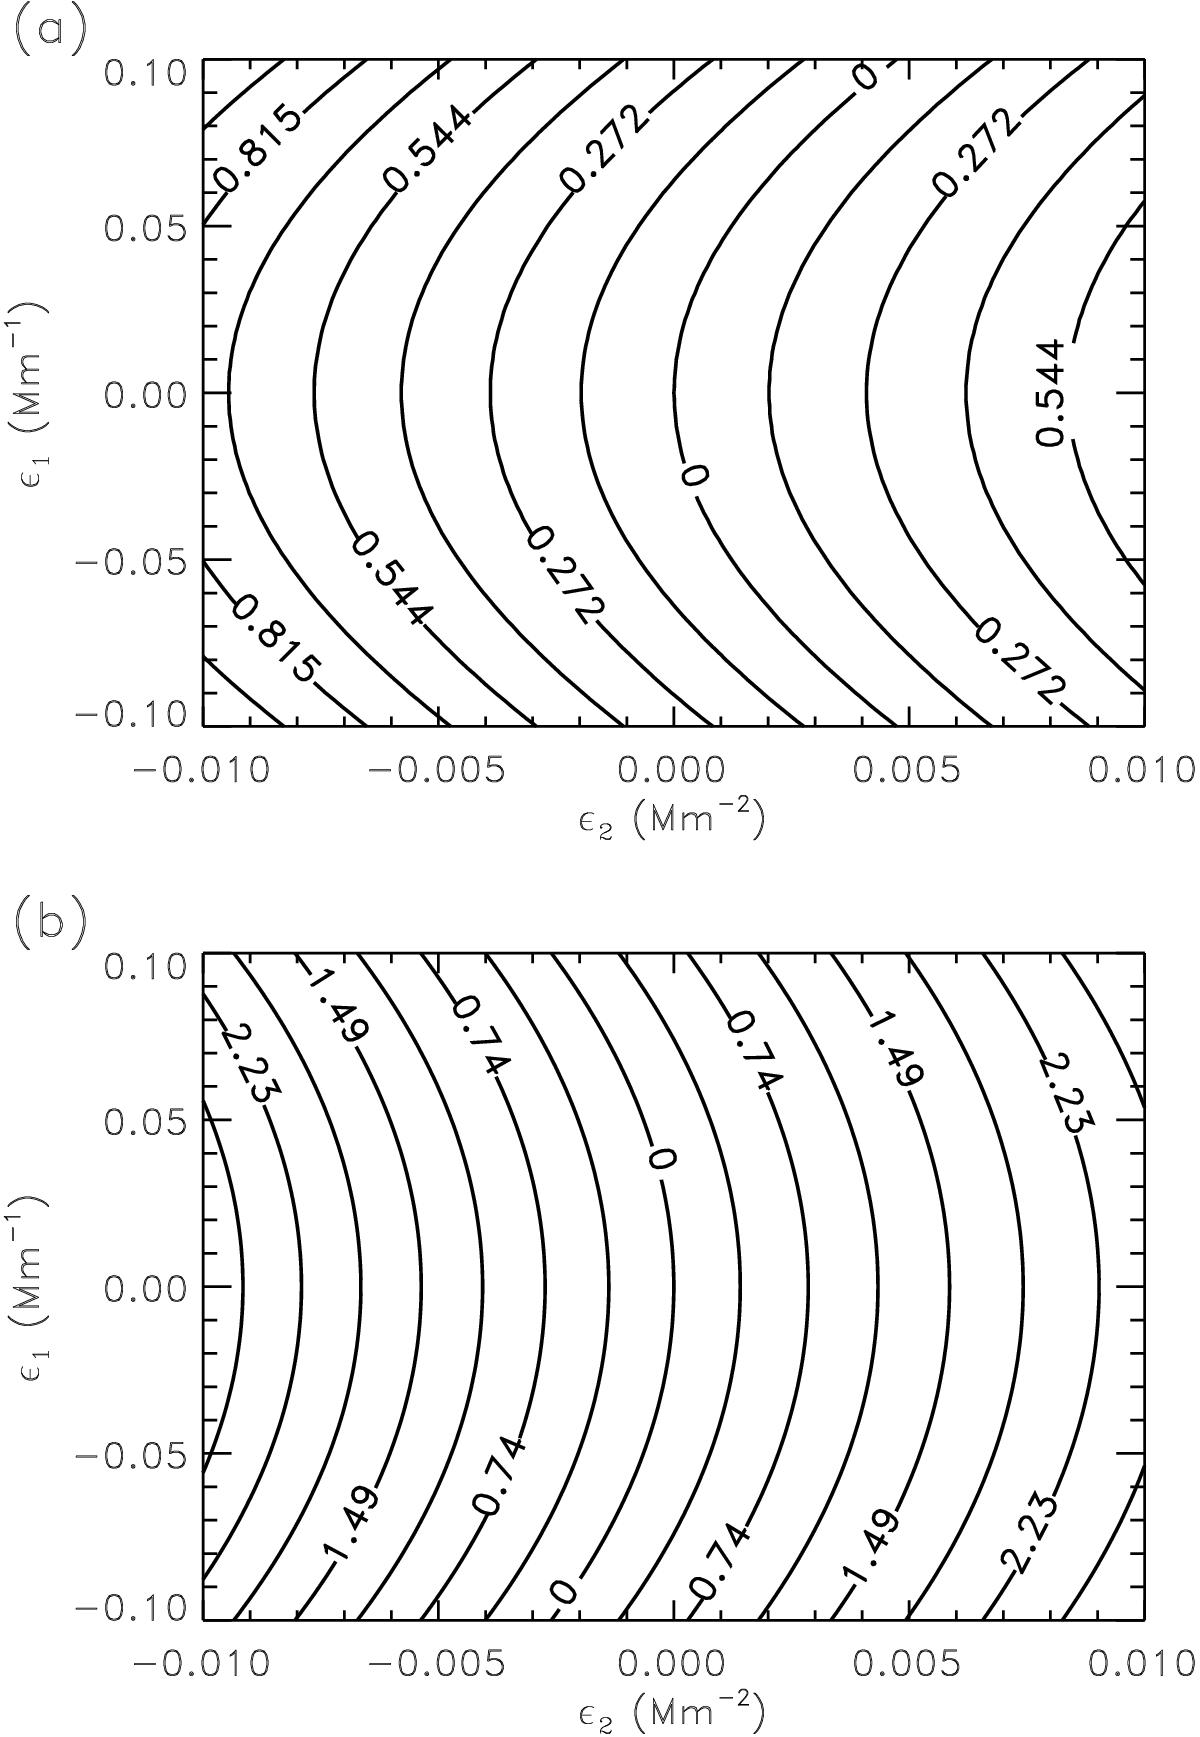
Contour lines of the δ function of a) the fundamental mode and b) the first overtone. The δ function is computed with Eq. (36) using the mode frequencies for realistic ϵ1 and ϵ2 values. The labels of the contour lines are a percentage of the reference ω0 values.
This figure is made of several images, please see below:
Current usage metrics show cumulative count of Article Views (full-text article views including HTML views, PDF and ePub downloads, according to the available data) and Abstracts Views on Vision4Press platform.
Data correspond to usage on the plateform after 2015. The current usage metrics is available 48-96 hours after online publication and is updated daily on week days.
Initial download of the metrics may take a while.