Fig. 2
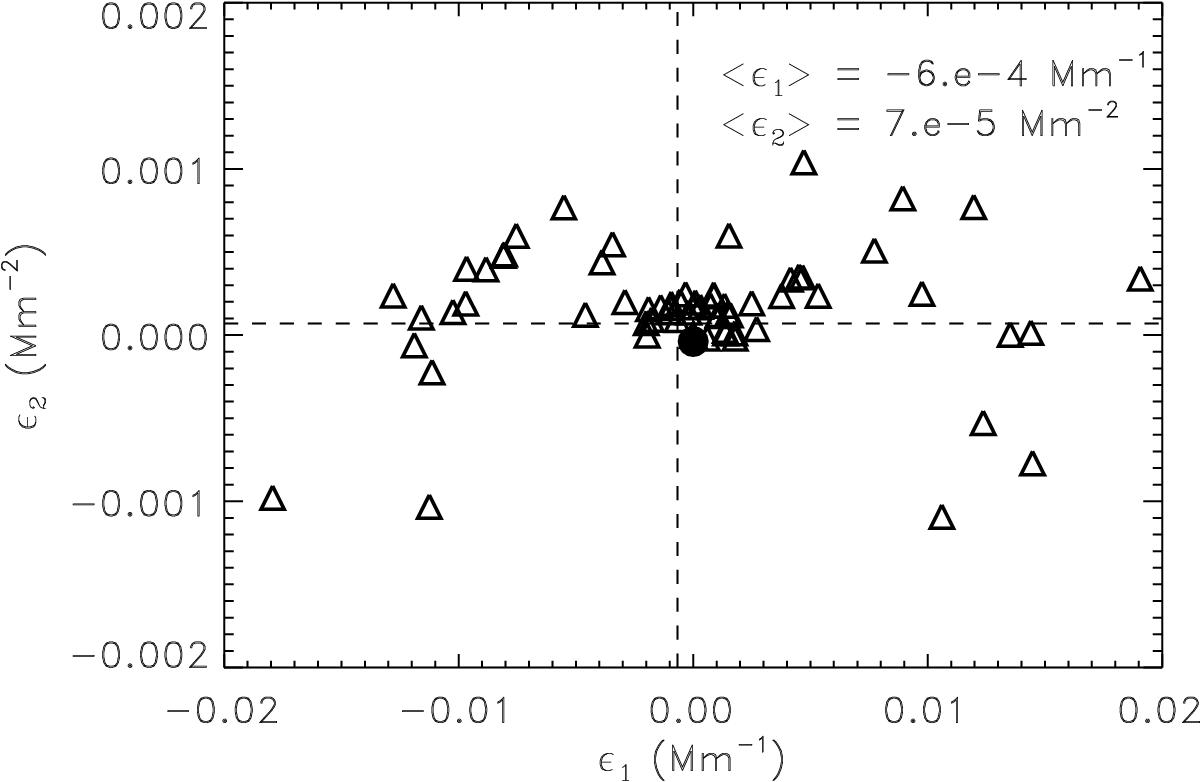
Scatter plot of the flux tube expansion factors. Each point represents the asymmetric and symmetric factors ϵ1 and ϵ2, respectively, for the same flux tube. The flux tubes are from Luna et al. (2012b; triangles) and from Terradas et al. (2013; big dot). The vertical and horizontal dashed lines corresponds to the average values of ϵ1 and ϵ2 factors, respectively.
Current usage metrics show cumulative count of Article Views (full-text article views including HTML views, PDF and ePub downloads, according to the available data) and Abstracts Views on Vision4Press platform.
Data correspond to usage on the plateform after 2015. The current usage metrics is available 48-96 hours after online publication and is updated daily on week days.
Initial download of the metrics may take a while.