Free Access
Fig. 6
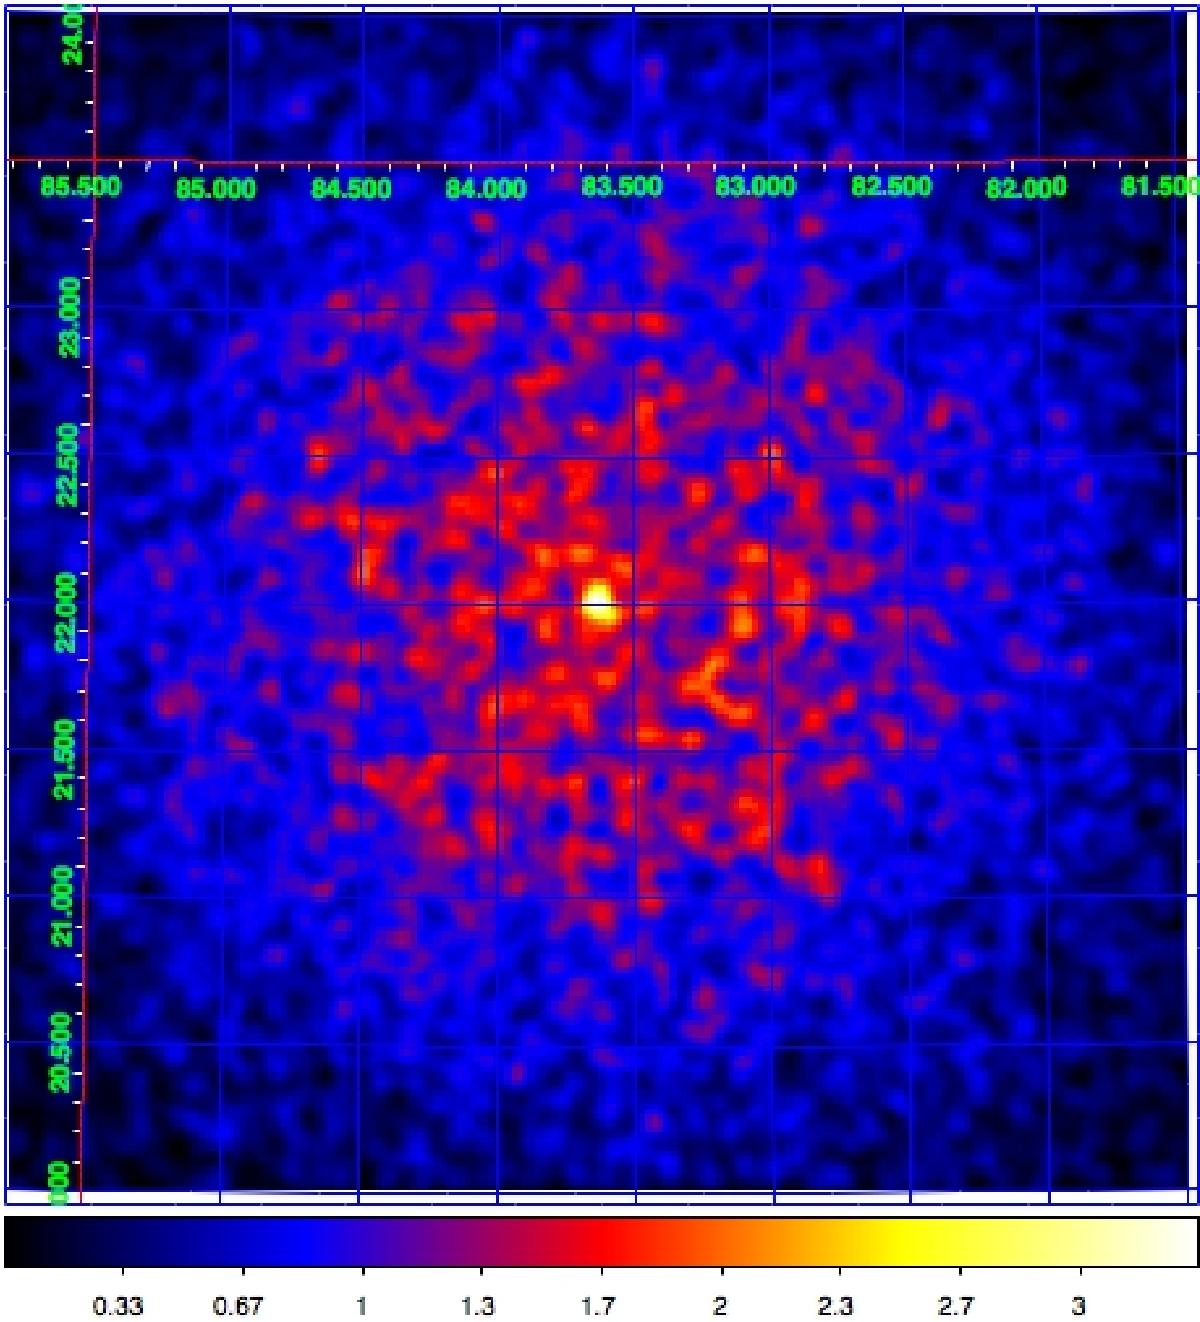
Sky map of the observed events above 100 GeV for a simulated source with a flux of 10 mCrab, observed with the southern CTA array for 60 min. We note that the map is not background subtracted.
Current usage metrics show cumulative count of Article Views (full-text article views including HTML views, PDF and ePub downloads, according to the available data) and Abstracts Views on Vision4Press platform.
Data correspond to usage on the plateform after 2015. The current usage metrics is available 48-96 hours after online publication and is updated daily on week days.
Initial download of the metrics may take a while.