Free Access
Fig. 10
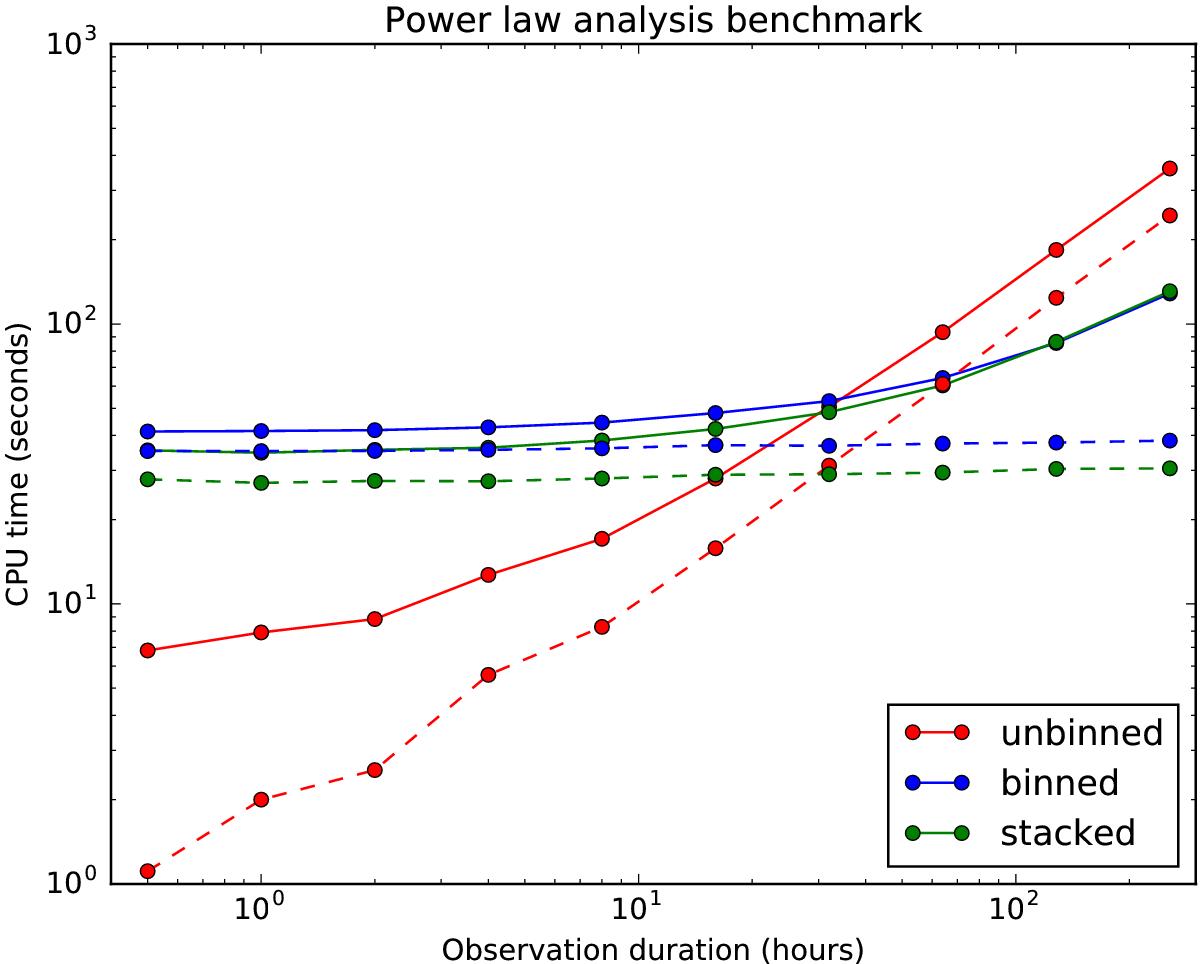
Graphical representation of the ctools computing benchmark results for the fit of the spectrum of a single point source. Solid lines give the total time spent in the pipelines while dashed lines represent the time spent in the ctlike tool only.
Current usage metrics show cumulative count of Article Views (full-text article views including HTML views, PDF and ePub downloads, according to the available data) and Abstracts Views on Vision4Press platform.
Data correspond to usage on the plateform after 2015. The current usage metrics is available 48-96 hours after online publication and is updated daily on week days.
Initial download of the metrics may take a while.