Fig. 5
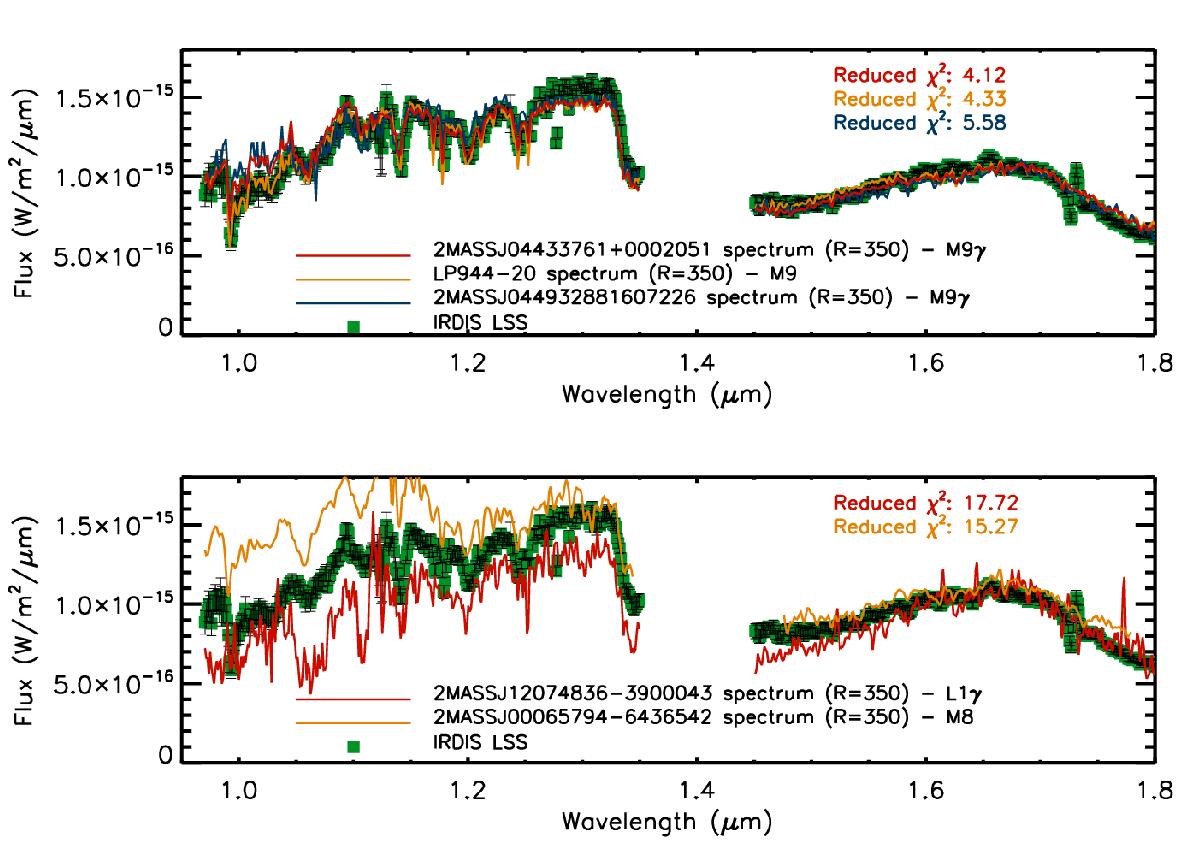
Upper panel: LSS medium-resolution (R = 350) spectrum is displayed with green squares, with error bars shown for each spectrum value. The three best-fit spectra from the spectral libraries described in the text are also plotted. Lower panel: similar to the upper panel, but with M8 and L1 spectra superimposed to illustrate the imperfect fit obtained in these cases.
Current usage metrics show cumulative count of Article Views (full-text article views including HTML views, PDF and ePub downloads, according to the available data) and Abstracts Views on Vision4Press platform.
Data correspond to usage on the plateform after 2015. The current usage metrics is available 48-96 hours after online publication and is updated daily on week days.
Initial download of the metrics may take a while.