Free Access
Fig. 3
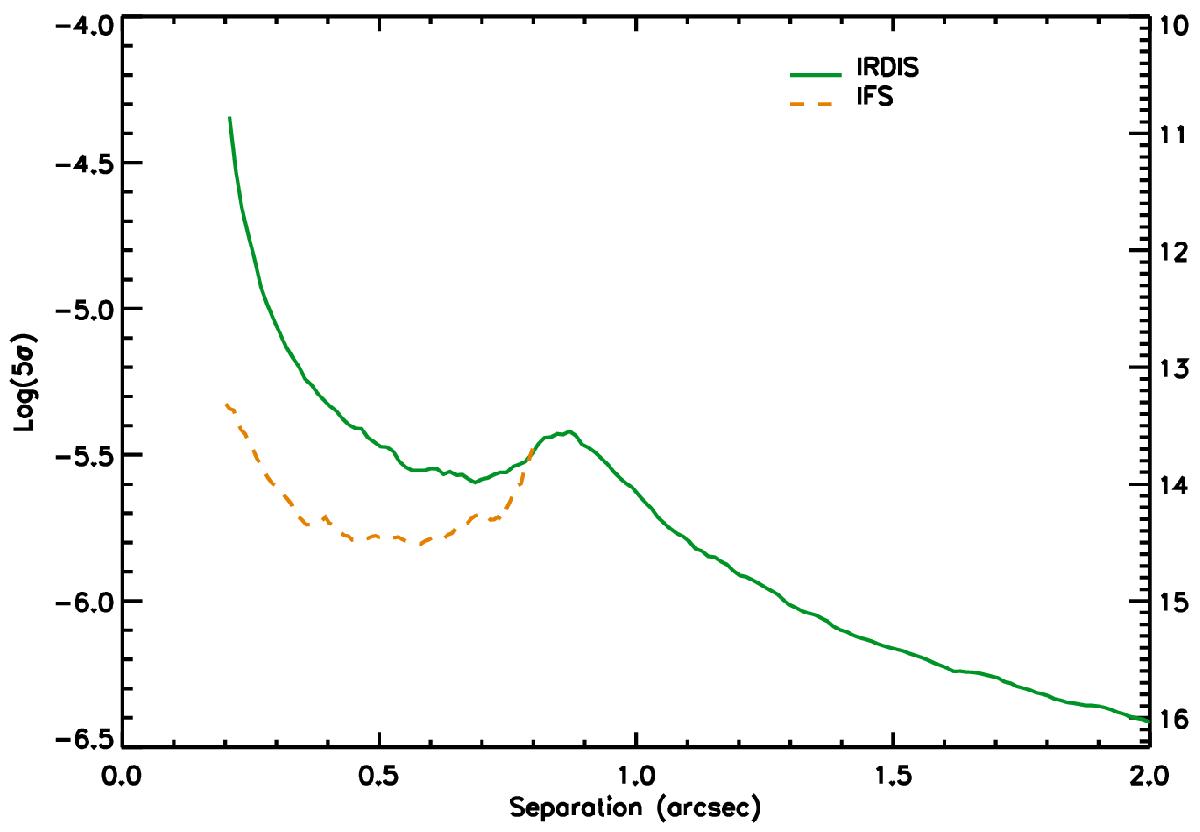
Contrast plot for our HR 3549 observations. The IRDIS contrast is plotted with a green solid line while the IFS contrast is plotted with an orange dashed line. The contrast for both instruments was obtained using the PCA algorithm.
Current usage metrics show cumulative count of Article Views (full-text article views including HTML views, PDF and ePub downloads, according to the available data) and Abstracts Views on Vision4Press platform.
Data correspond to usage on the plateform after 2015. The current usage metrics is available 48-96 hours after online publication and is updated daily on week days.
Initial download of the metrics may take a while.