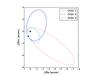
Fig. 10
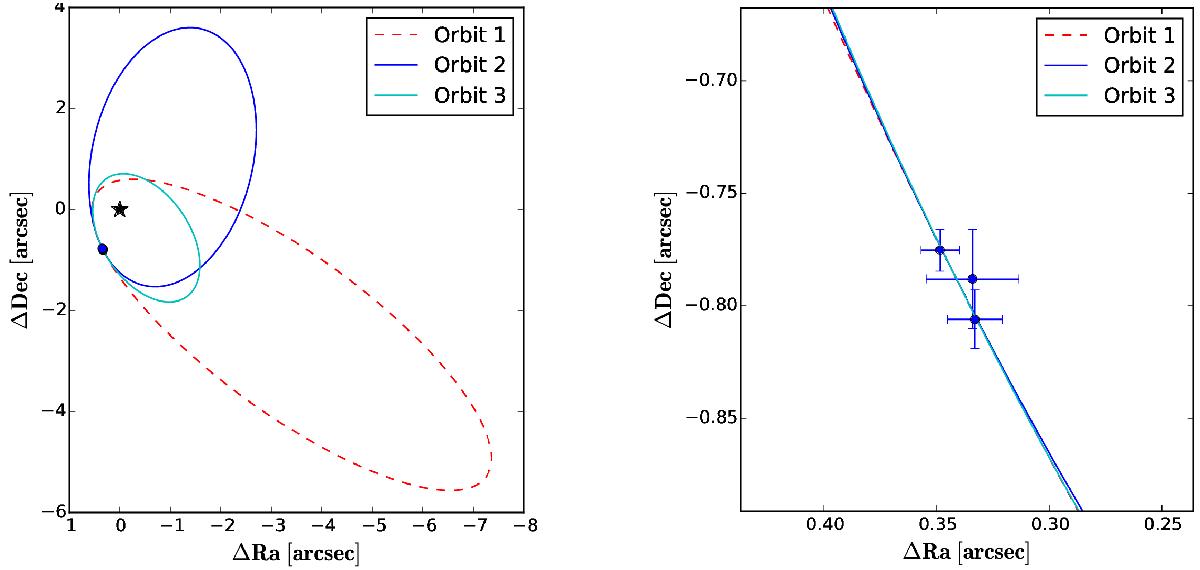
Left: top three best-fitting orbits out of 5 × 10⁶ runs of our LSMC fit for a mass of 1.22 M⊙. Solid lines represent the apparent orbits. Here the red dashed lines represent best-fitting orbits that are not compatible with the disk while the blue lines represent orbits compatible with the disk. Right: same image zoomed-in on the data points. The corresponding orbit elements are listed in Table 6.
Current usage metrics show cumulative count of Article Views (full-text article views including HTML views, PDF and ePub downloads, according to the available data) and Abstracts Views on Vision4Press platform.
Data correspond to usage on the plateform after 2015. The current usage metrics is available 48-96 hours after online publication and is updated daily on week days.
Initial download of the metrics may take a while.