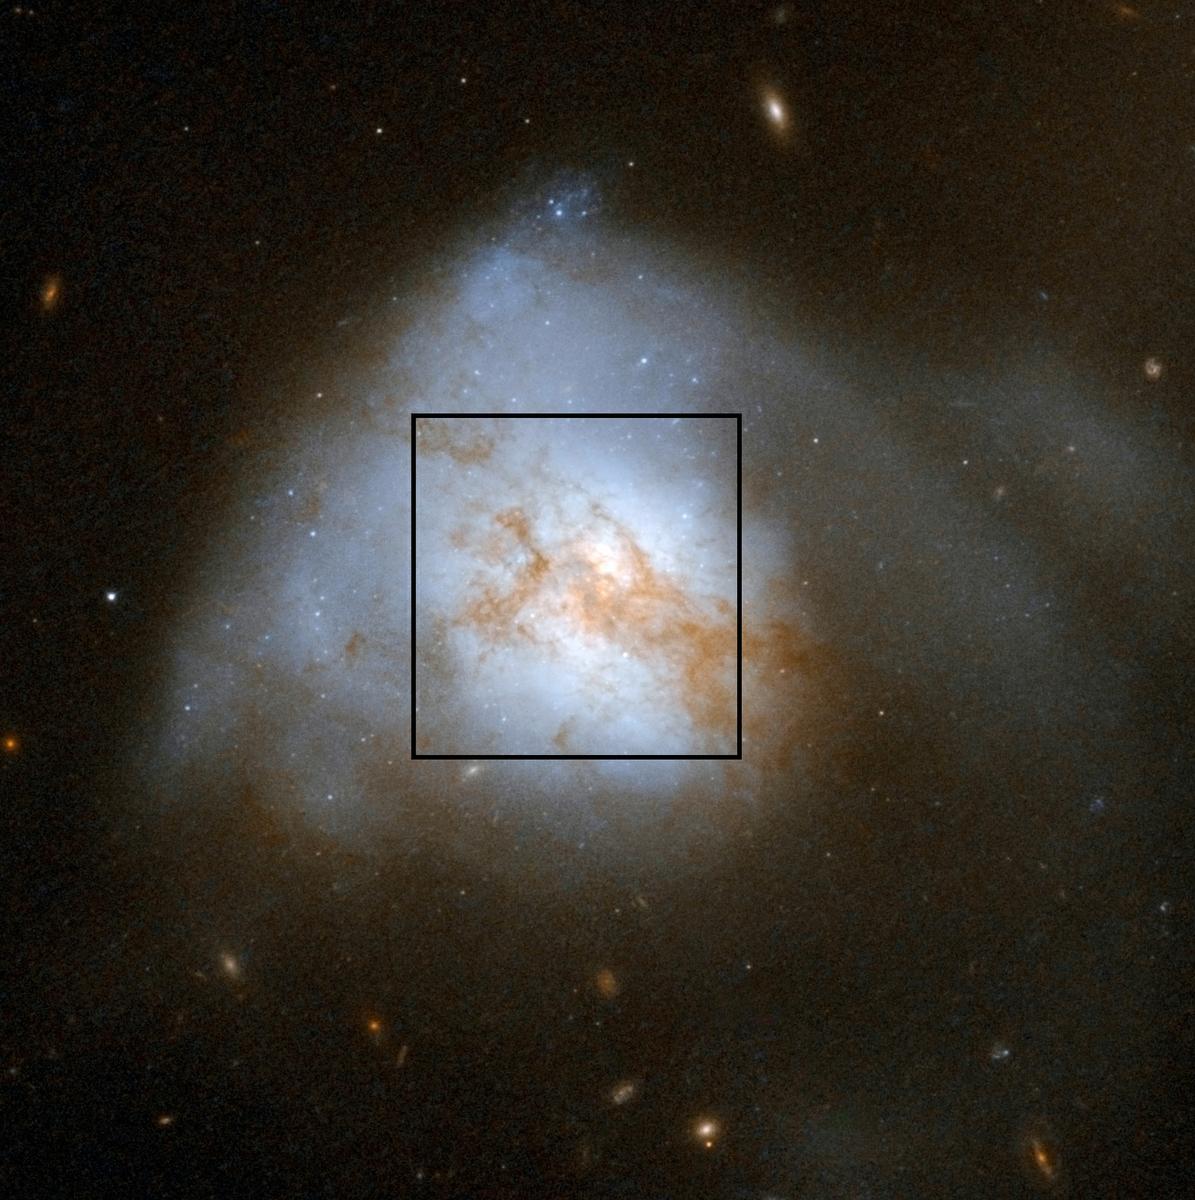
Fig. 8
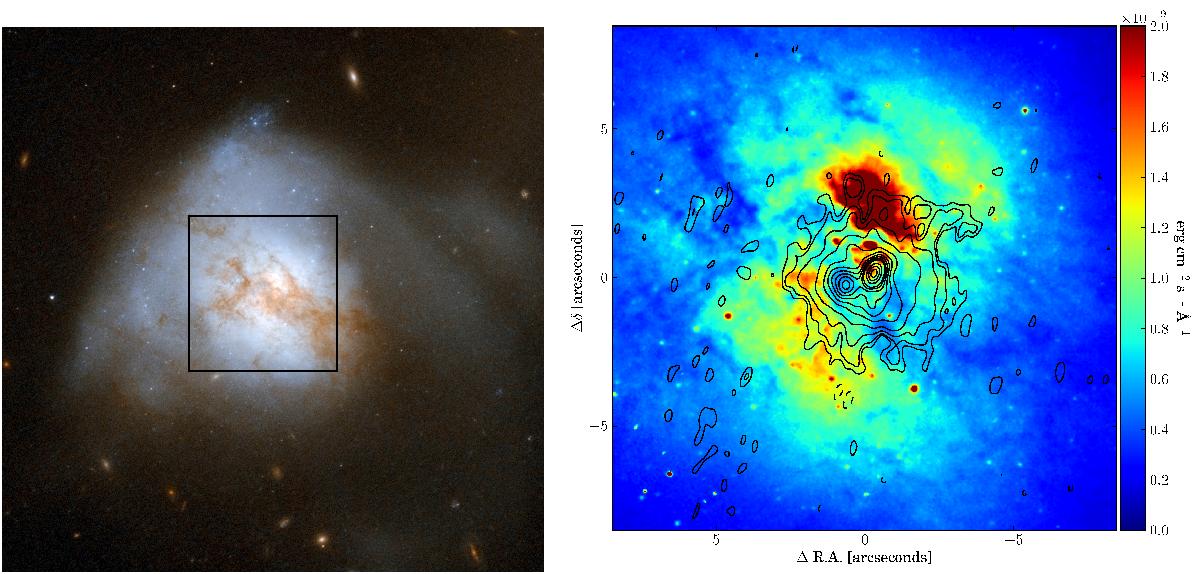
Left panel HST ACS colour image previously shown by Lockhart et al. (2015), where north is up and east is left. Note the tails on the west side and the compressed, almost flat, side of the galaxy towards the north-east, as well as significant extinction by dust towards the centre. The box has sides of approximately 15′′ and indicates the extent of the right panel. Right panel: zoom showing the F814W (I-band) data with a saturated colour scale for easy comparison to the results presented in Arribas et al. (2001), their Fig. 2. The black contours are the 150 MHz continuum at the same levels as in Fig. 1a.
Current usage metrics show cumulative count of Article Views (full-text article views including HTML views, PDF and ePub downloads, according to the available data) and Abstracts Views on Vision4Press platform.
Data correspond to usage on the plateform after 2015. The current usage metrics is available 48-96 hours after online publication and is updated daily on week days.
Initial download of the metrics may take a while.