Fig. 7
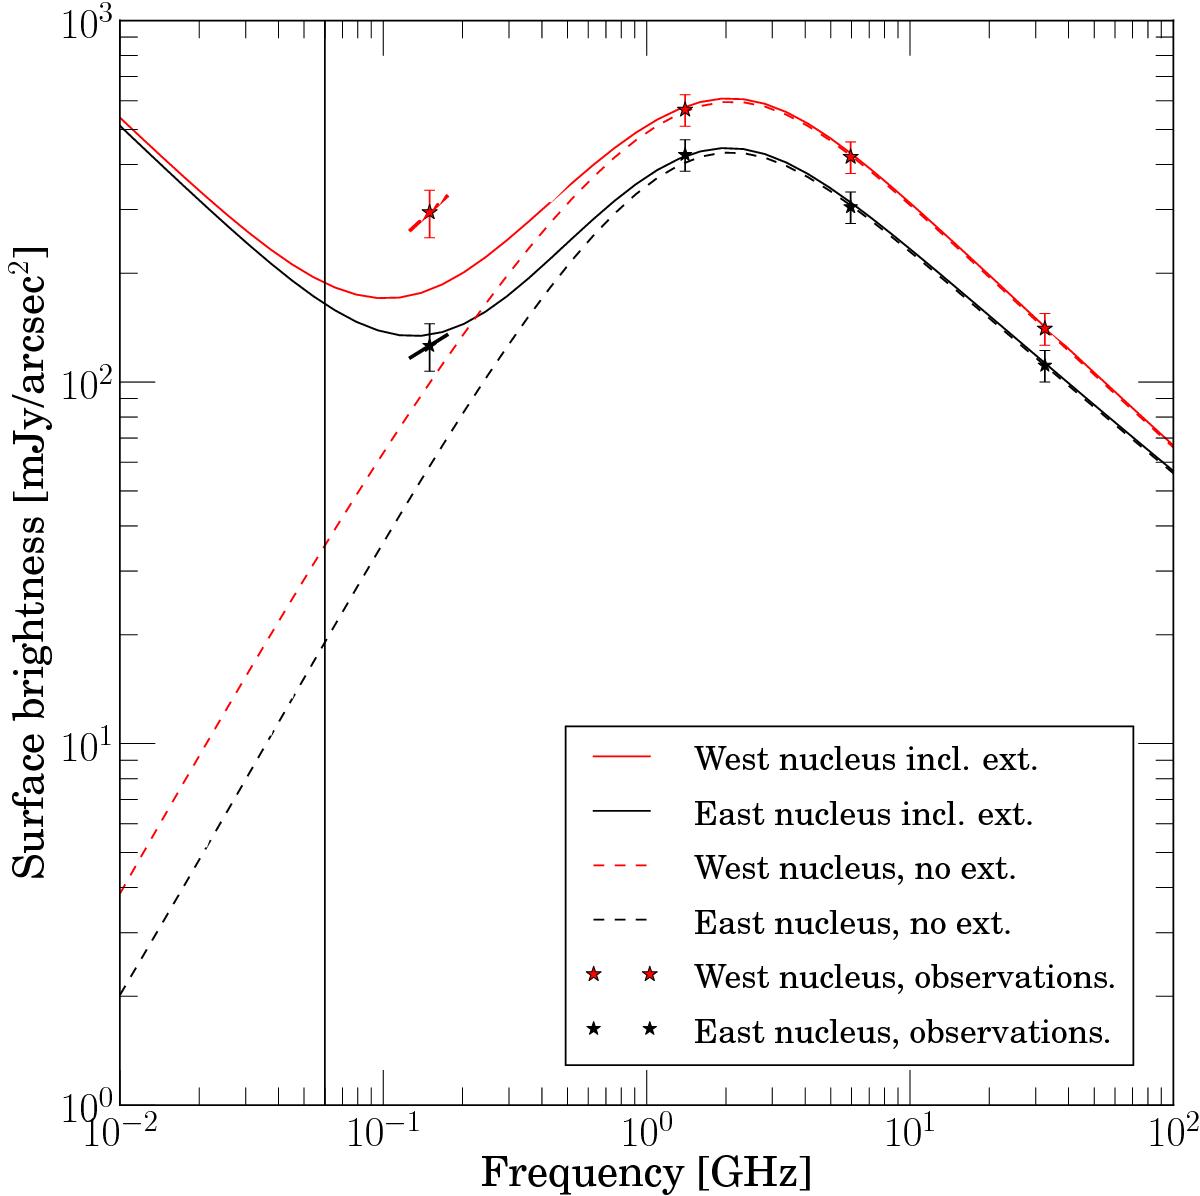
Measured and modelled spectra of the eastern (black) and western (red) nuclei. Surface brightness measurements (Table 3) are plotted as stars. The thick line segments going through the 150 MHz measurements illustrate the measured LOFAR in-band spectral index at the GHz positions of the nuclei, see also Fig. 4a. The solid lines show the surface brightness at 33 GHz positions of the two nuclei, as predicted by the three component model described in Sect. 4. The dashed lines show the spectra of the nuclei without any extended component, i.e. only the exponential disks described in Sect. 4.1 following Eq. (4). The thin black vertical line indicates the frequency 60 MHz where future observations with the International LOFAR Low Band Array could be used to obtain ![]() resolution images.
resolution images.
Current usage metrics show cumulative count of Article Views (full-text article views including HTML views, PDF and ePub downloads, according to the available data) and Abstracts Views on Vision4Press platform.
Data correspond to usage on the plateform after 2015. The current usage metrics is available 48-96 hours after online publication and is updated daily on week days.
Initial download of the metrics may take a while.