Fig. 6
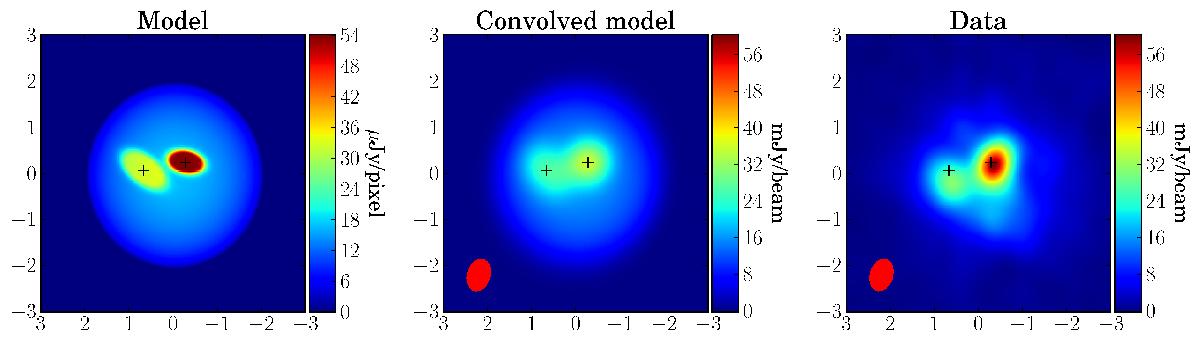
A three-component model of two exponential disks and a uniform sphere as described in Sect. 4. The left panel shows the model prediction at 150 MHz. The middle panel shows the same model after convolving to a resolution of ![]() (shown as a red ellipse in the lower left). The right panel shows the data at 150 MHz convolved to the same resolution. Note that the middle and right panels have the same colour scale for easy comparison. The crosses mark the 33 GHz positions of the two nuclei. Note that the nuclei follow Eq. (4) and are therefore almost completely saturated at 150 MHz.
(shown as a red ellipse in the lower left). The right panel shows the data at 150 MHz convolved to the same resolution. Note that the middle and right panels have the same colour scale for easy comparison. The crosses mark the 33 GHz positions of the two nuclei. Note that the nuclei follow Eq. (4) and are therefore almost completely saturated at 150 MHz.
Current usage metrics show cumulative count of Article Views (full-text article views including HTML views, PDF and ePub downloads, according to the available data) and Abstracts Views on Vision4Press platform.
Data correspond to usage on the plateform after 2015. The current usage metrics is available 48-96 hours after online publication and is updated daily on week days.
Initial download of the metrics may take a while.