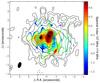
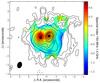
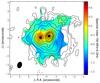
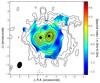
Fig. 4
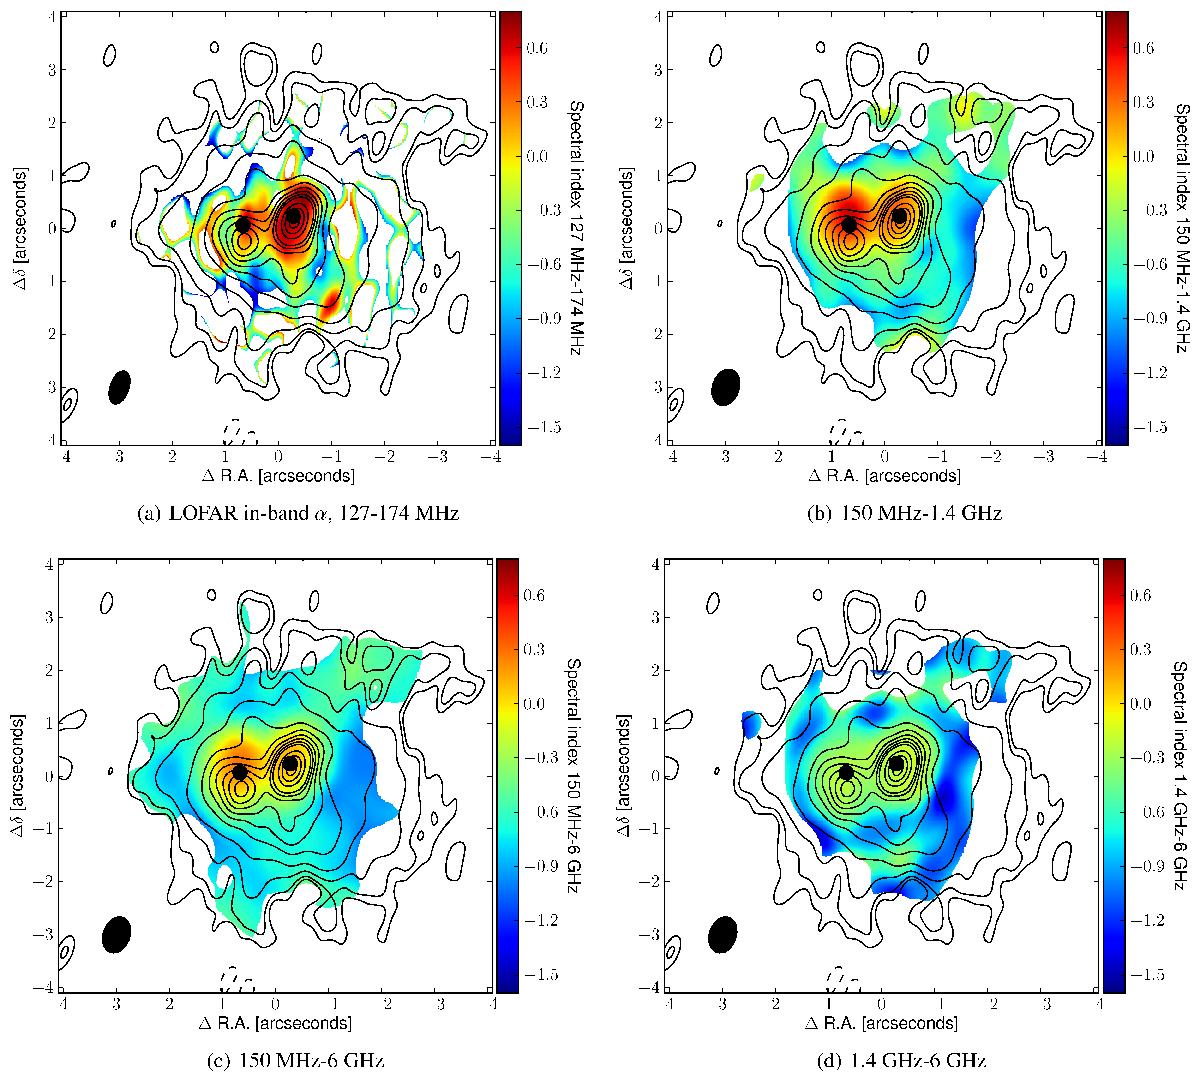
Spectral index maps using data from three radio bands, overlayed with the same 150 MHz contours as in Fig. 1a. Panel a) shows the in-band spectral index as recovered by MFS-CLEAN of the LOFAR data covering 127−174 MHz. Panel b) shows the spectral index between 150 MHz and 1.4 GHz, panel c) between 150 MHz and 6 GHz, and panel d) between 1.4 GHz and 6 GHz. The (convolved) resolution is plotted in the lower left of each panel. The black dots in the centre mark the 33 GHz positions as in Fig. 1a. White pixels were clipped as described in Sect. 3.2.2.
Current usage metrics show cumulative count of Article Views (full-text article views including HTML views, PDF and ePub downloads, according to the available data) and Abstracts Views on Vision4Press platform.
Data correspond to usage on the plateform after 2015. The current usage metrics is available 48-96 hours after online publication and is updated daily on week days.
Initial download of the metrics may take a while.