Fig. 3
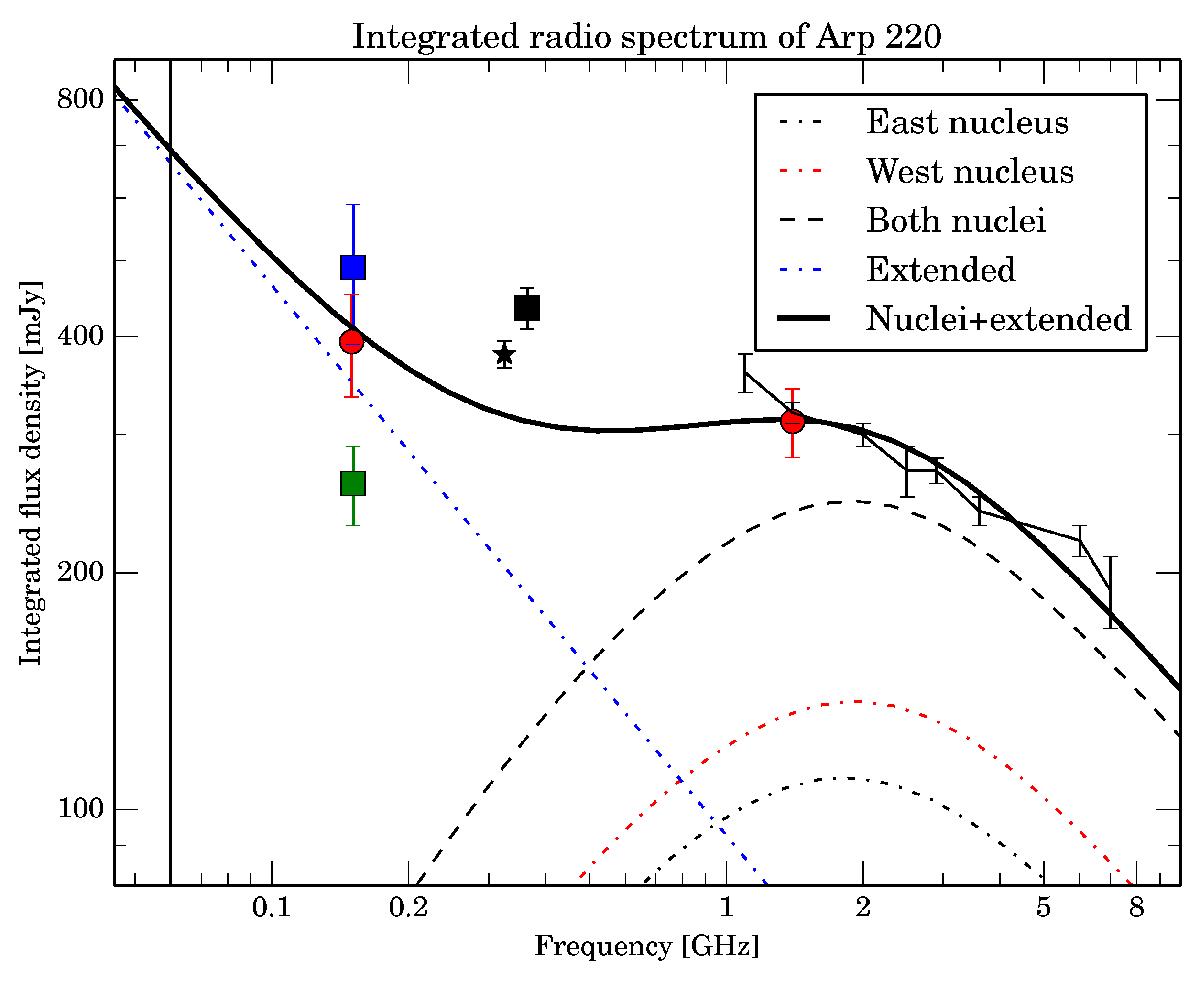
The integrated low-frequency radio spectrum of Arp 220. Red circles are from this work, see Table 2. Green square (260 ± 30@151 MHz) from Sopp & Alexander (1991), blue square (490 ± 88@151 MHz) from Waldram et al. (1996), black star (380 ± 15@325 MHz) from Anantharamaiah et al. (2000), black square (435 ± 26@365 MHz) from Douglas et al. (1996). Black line segment from Williams & Bower (2010) with resolution 250′′ at 1 GHz to 35′′ at 7 GHz. See Sect. 3.1 for a discussion on the discrepancy of the measurements at 150 MHz. The dotted-dashed curves show contributions of the three components in the model described in Sect. 4, the dashed line shows the sum of the two nuclei, and the solid black curve is the sum of all three components. The solid black vertical line indicates the frequency 60 MHz where future observations with the International LOFAR Low Band Array could be used to obtain ![]() resolution images.
resolution images.
Current usage metrics show cumulative count of Article Views (full-text article views including HTML views, PDF and ePub downloads, according to the available data) and Abstracts Views on Vision4Press platform.
Data correspond to usage on the plateform after 2015. The current usage metrics is available 48-96 hours after online publication and is updated daily on week days.
Initial download of the metrics may take a while.