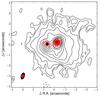
Fig. 2
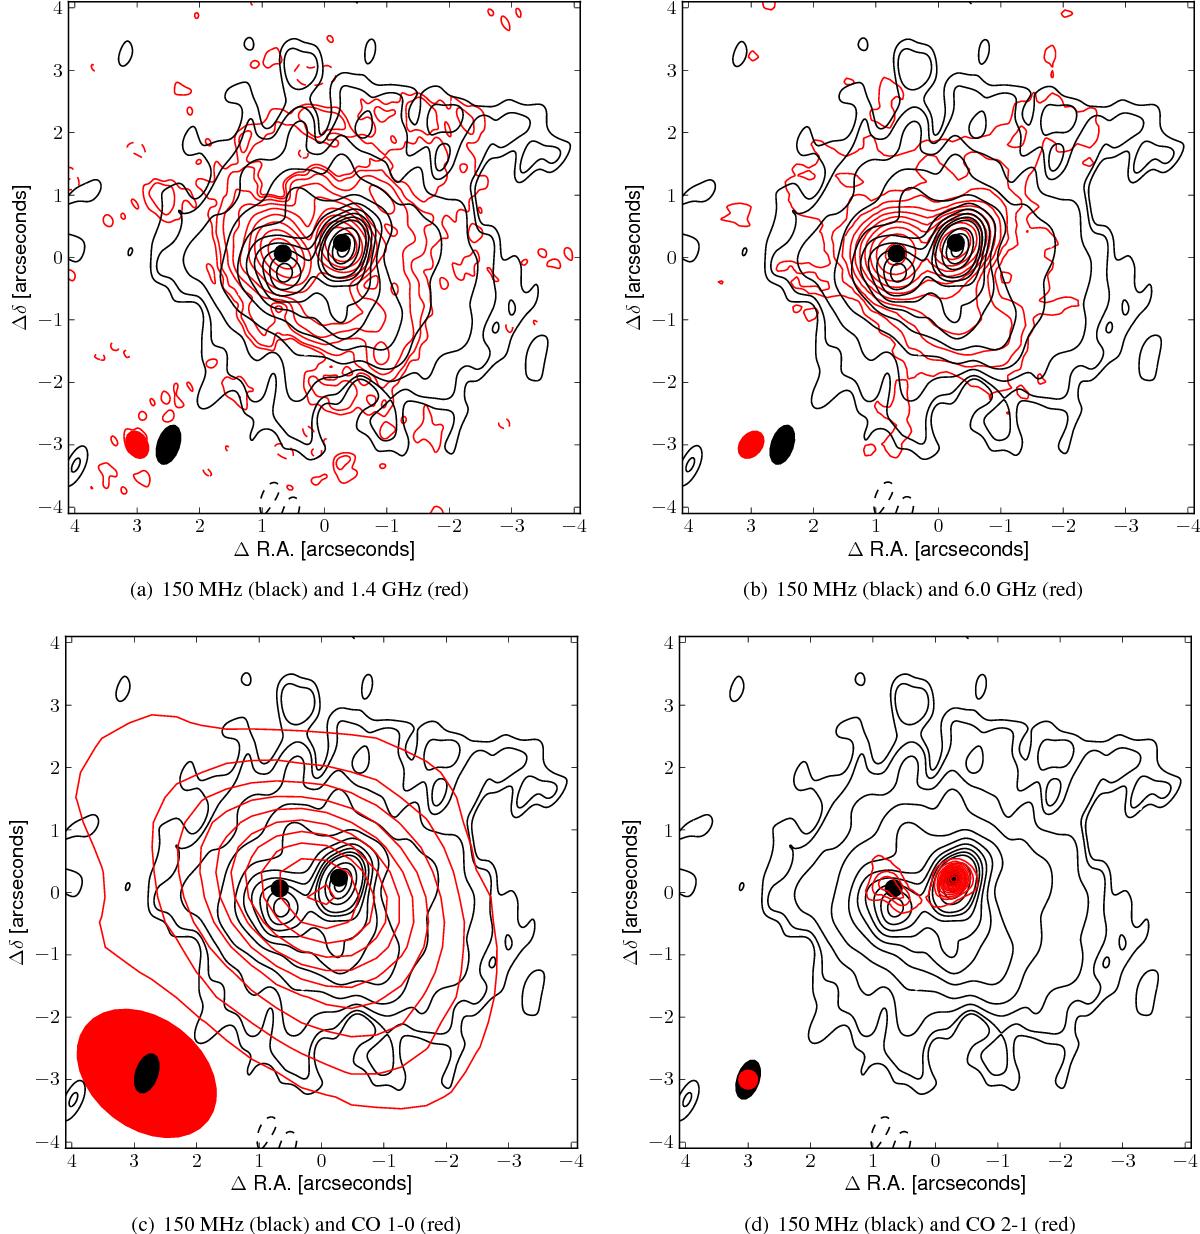
Comparison of the emission detected at 150 MHz with emission at four other wavelengths. Black contours represent the 150 MHz emission using the same contours as in Fig. 1a. Panel a) shows the combined VLA+MERLIN 1.4 GHz continuum as contours at [−3, 3, 5, 10, 20, 40, 80, 160, 320, 640] × 60 μJy beam-1. Panel b) shows the VLA 6 GHz continuum as contours at [−5, 5, 10, 20, 40, 80, 160, 320, 640, 1280, 2560] × 14 μJy beam-1. Panel c) shows CO(1−0) as contours at [10, 50, 90, 130, 170, 210, 250, 290, 330, 370] × 13.906 K kms-1. Panel d) shows CO(2−1) as contours at [2, 4, 6, 8, 10, 12, 14, 16, 18, 20, 22, 24] × 1184.69 K kms-1. The respective CLEAN restoring beams are plotted in the lower left of each panel in red: a)![]() ; b)
; b)![]() ; c)
; c)![]() ; and d)
; and d)![]() . In all panels the LOFAR beam of
. In all panels the LOFAR beam of ![]() is plotted in black. The black dots in the centre mark the 33 GHz positions as in Fig. 1a.
is plotted in black. The black dots in the centre mark the 33 GHz positions as in Fig. 1a.
Current usage metrics show cumulative count of Article Views (full-text article views including HTML views, PDF and ePub downloads, according to the available data) and Abstracts Views on Vision4Press platform.
Data correspond to usage on the plateform after 2015. The current usage metrics is available 48-96 hours after online publication and is updated daily on week days.
Initial download of the metrics may take a while.