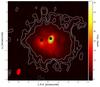
Fig. 1
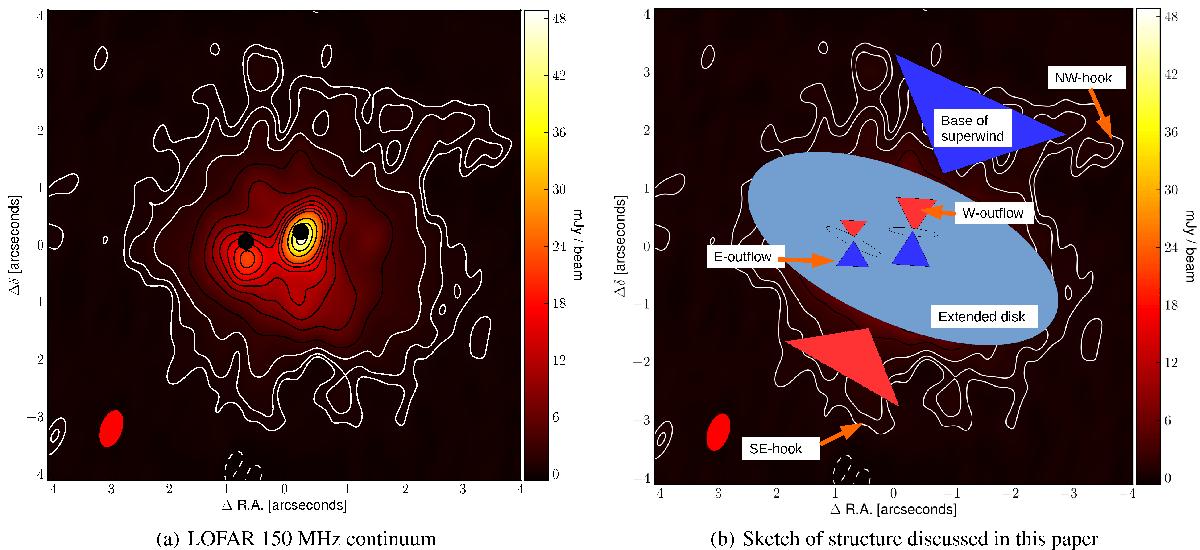
Panel a) the continuum emission at 150 MHz as detected with LOFAR, with contours at −3, 3, 5, 10, 20, 40, 60, 80, 100, 120, 140, 200, 250, 300] × 0.15 mJy beam-1 plotted in white in darker areas and black in brighter areas. The CLEAN restoring beam of ![]() , position angle 161°, is plotted as a solid red ellipse in the lower left. Positions are relative to RA
, position angle 161°, is plotted as a solid red ellipse in the lower left. Positions are relative to RA ![]() , Dec
, Dec ![]() . The black dots in the centre mark the 33 GHz continuum positions of the two nuclei (Barcos-Muñoz et al. 2015) with radius 133 mas illustrating the total maximum astrometric uncertainty between the 150 MHz (83 mas) and 33 GHz (50 mas). Panel b) a sketch of the structure discussed in this paper. The labels mark the extended kpc-scale disk, the outflows from the east and west nuclei (small ellipses), the large scale outflow and the north-west and south-east “hooks”. The blue triangles represent the closer sides of outflows and the red triangles the far sides.
. The black dots in the centre mark the 33 GHz continuum positions of the two nuclei (Barcos-Muñoz et al. 2015) with radius 133 mas illustrating the total maximum astrometric uncertainty between the 150 MHz (83 mas) and 33 GHz (50 mas). Panel b) a sketch of the structure discussed in this paper. The labels mark the extended kpc-scale disk, the outflows from the east and west nuclei (small ellipses), the large scale outflow and the north-west and south-east “hooks”. The blue triangles represent the closer sides of outflows and the red triangles the far sides.
Current usage metrics show cumulative count of Article Views (full-text article views including HTML views, PDF and ePub downloads, according to the available data) and Abstracts Views on Vision4Press platform.
Data correspond to usage on the plateform after 2015. The current usage metrics is available 48-96 hours after online publication and is updated daily on week days.
Initial download of the metrics may take a while.