Free Access
Fig. 5
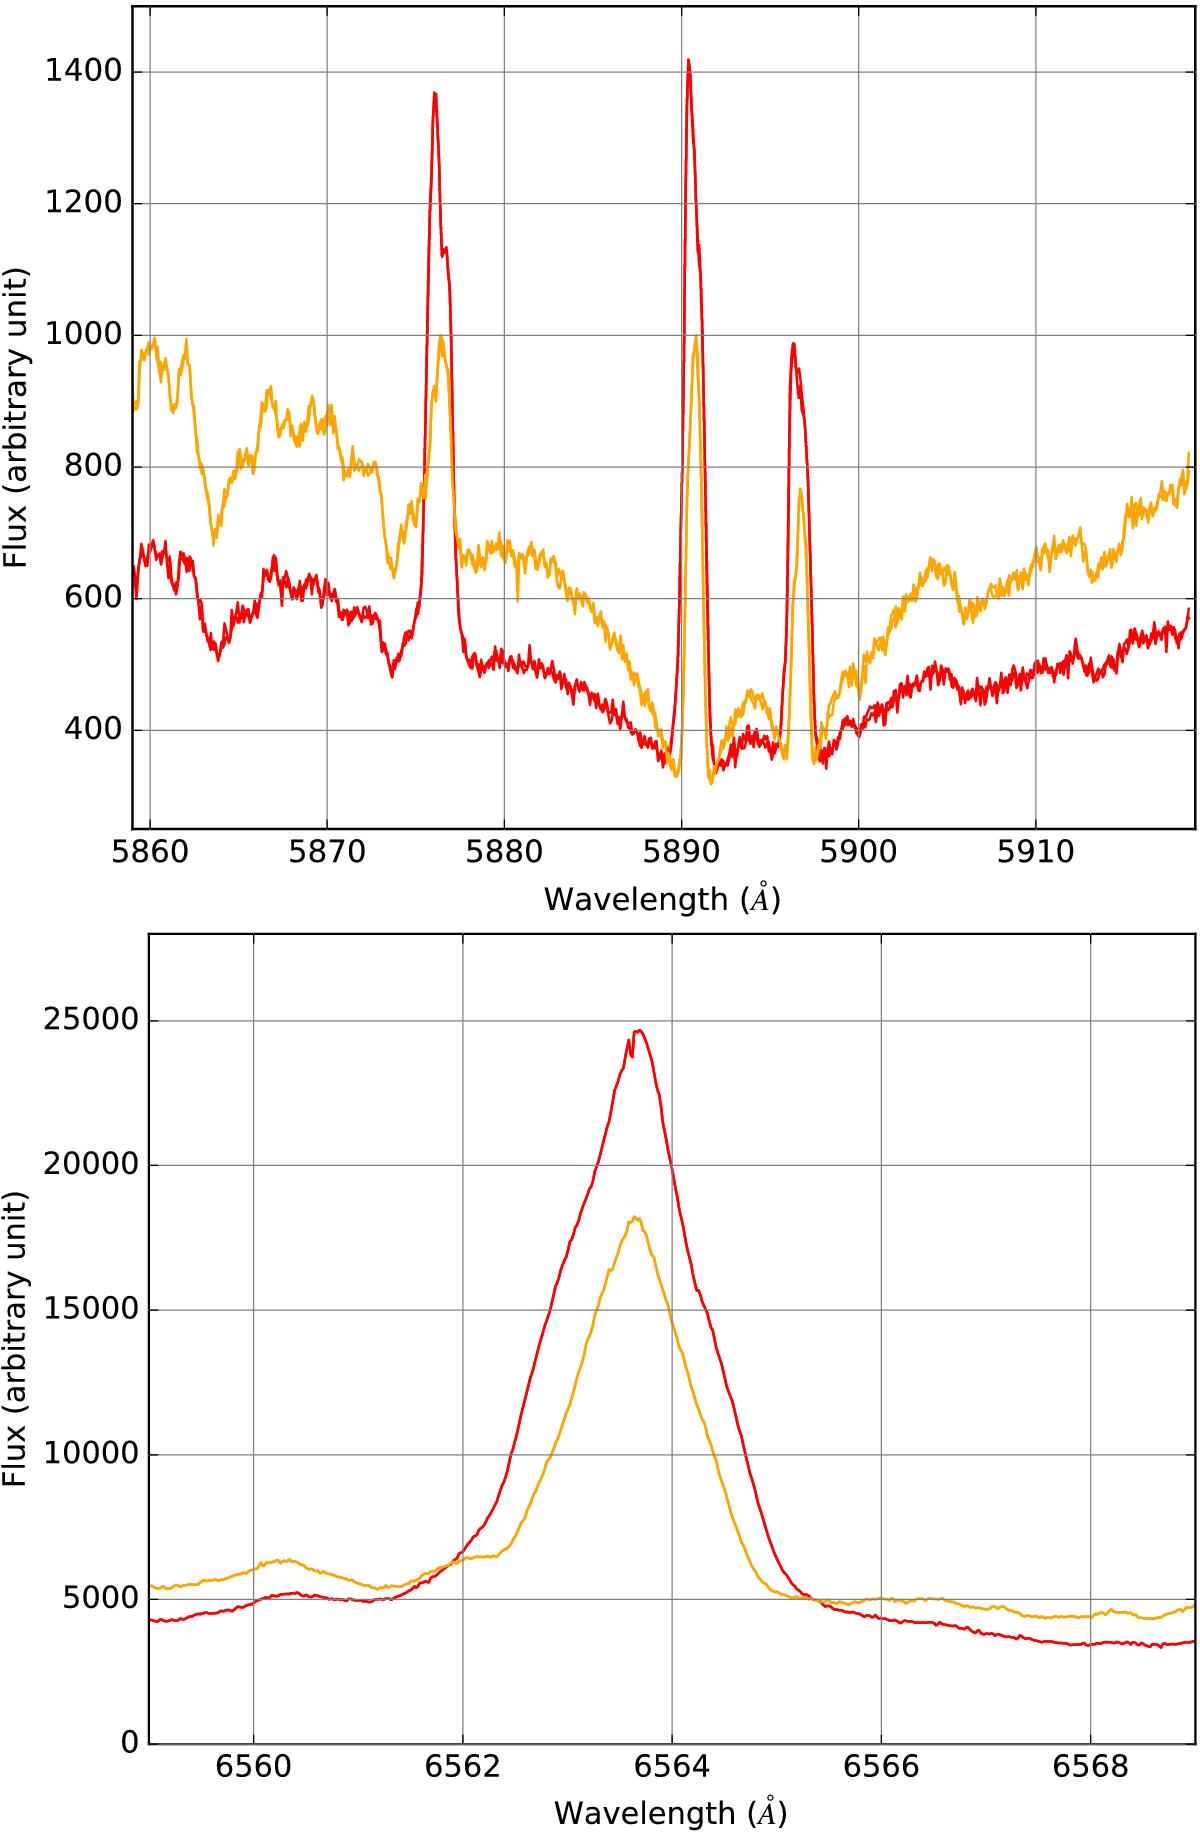
Region around the He I emission line at 5875 Å and the Na I doublet at 5890−5896 Å (top panel) in the UVES spectra of GJ65 A (orange) and B (red). The very intense Hα emission line is shown in the bottom panel. The spectra are not corrected for telluric lines.
This figure is made of several images, please see below:
Current usage metrics show cumulative count of Article Views (full-text article views including HTML views, PDF and ePub downloads, according to the available data) and Abstracts Views on Vision4Press platform.
Data correspond to usage on the plateform after 2015. The current usage metrics is available 48-96 hours after online publication and is updated daily on week days.
Initial download of the metrics may take a while.