Fig. 2
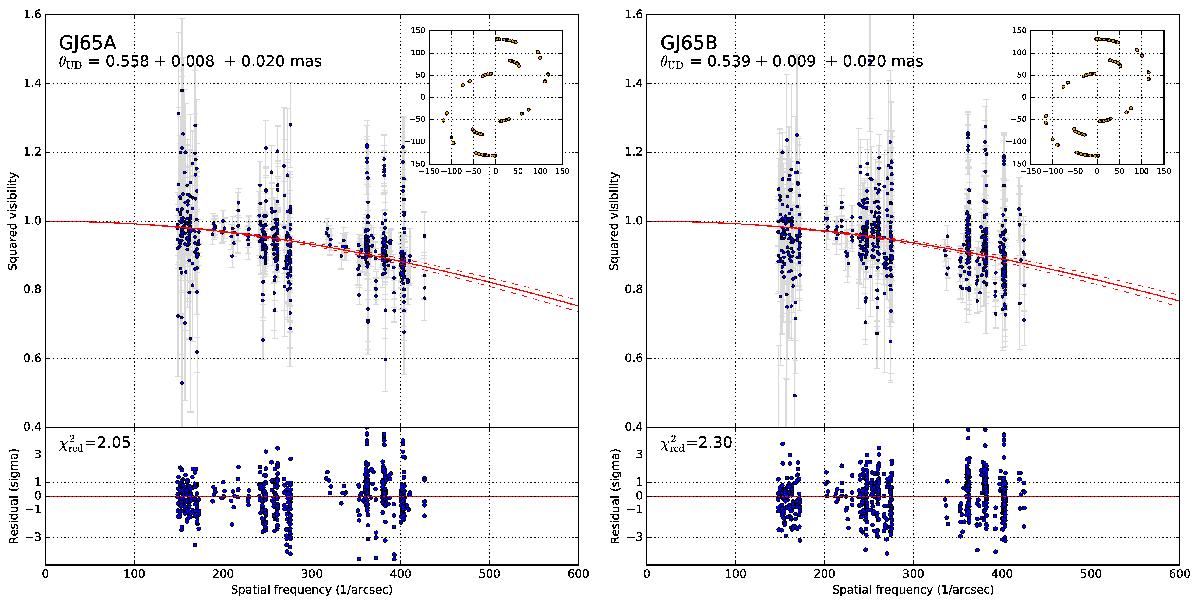
Squared visibilities of GJ65 A and B and adjusted uniform disk models. The statistical dispersion and the calibration systematic uncertainty are listed separately after the best-fit angular diameter. The dashed lines delimit the 1σ total uncertainty of the fit. The (u,v) plane coverage is shown in the top right panel, with axes labeled in meters. The residuals of the model fit are shown in the bottom panels, and the reduced χ2 values are computed considering only the statistical uncertainties.
Current usage metrics show cumulative count of Article Views (full-text article views including HTML views, PDF and ePub downloads, according to the available data) and Abstracts Views on Vision4Press platform.
Data correspond to usage on the plateform after 2015. The current usage metrics is available 48-96 hours after online publication and is updated daily on week days.
Initial download of the metrics may take a while.