Free Access
Fig. 9
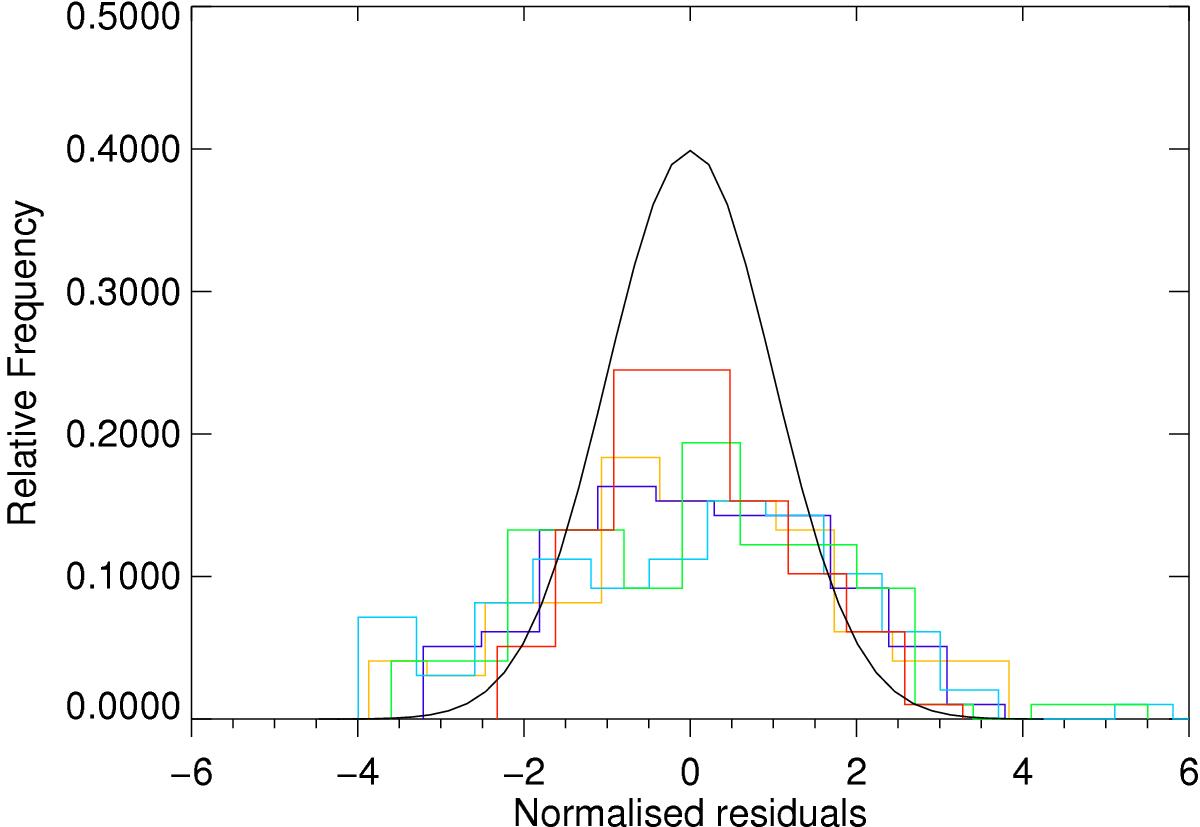
Distribution of normalised residuals for all the fitted models. The black line shows a normal distribution. The legend for the different distributions is as follows: quartic Gaussian (purple); quartic exponential (yellow); cubic Gaussian (green); cubic exponential (blue); time-dependent (red).
Current usage metrics show cumulative count of Article Views (full-text article views including HTML views, PDF and ePub downloads, according to the available data) and Abstracts Views on Vision4Press platform.
Data correspond to usage on the plateform after 2015. The current usage metrics is available 48-96 hours after online publication and is updated daily on week days.
Initial download of the metrics may take a while.