Free Access
Fig. 6
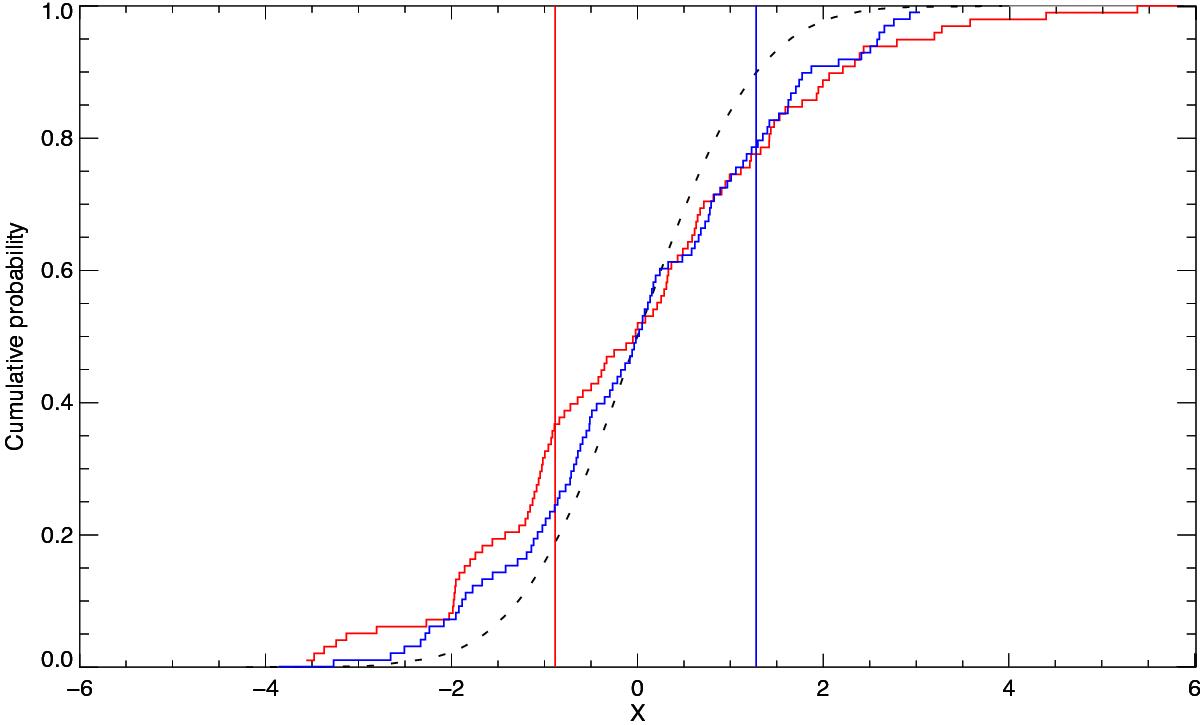
Examples of the KS one sample test. The ECDF of the residuals for the cubic Gaussian damping (red), time-dependent quartic Gaussian damping (blue) and normal CDF (dashed). The solid vertical lines show the location of the maximum distance between the ECDF and CDF.
Current usage metrics show cumulative count of Article Views (full-text article views including HTML views, PDF and ePub downloads, according to the available data) and Abstracts Views on Vision4Press platform.
Data correspond to usage on the plateform after 2015. The current usage metrics is available 48-96 hours after online publication and is updated daily on week days.
Initial download of the metrics may take a while.