Fig. 5
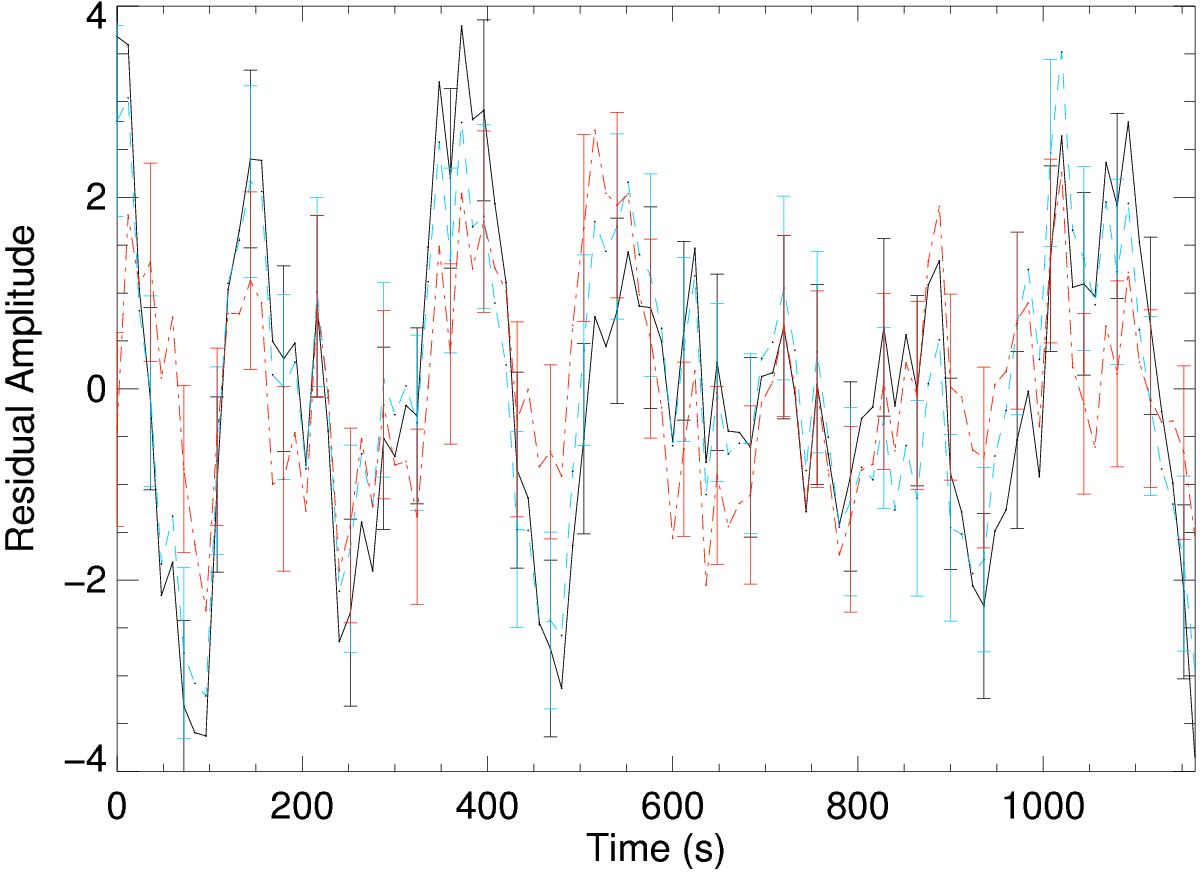
Averaged normalised residuals for the different models with the fourth-order polynomial trend. The black solid line shows the exponential damping profile, the blue dashed line is the Gaussian damping profile and the red dash-dot is the time-dependent model. The normalised error bars are also displayed for every third data point.
Current usage metrics show cumulative count of Article Views (full-text article views including HTML views, PDF and ePub downloads, according to the available data) and Abstracts Views on Vision4Press platform.
Data correspond to usage on the plateform after 2015. The current usage metrics is available 48-96 hours after online publication and is updated daily on week days.
Initial download of the metrics may take a while.