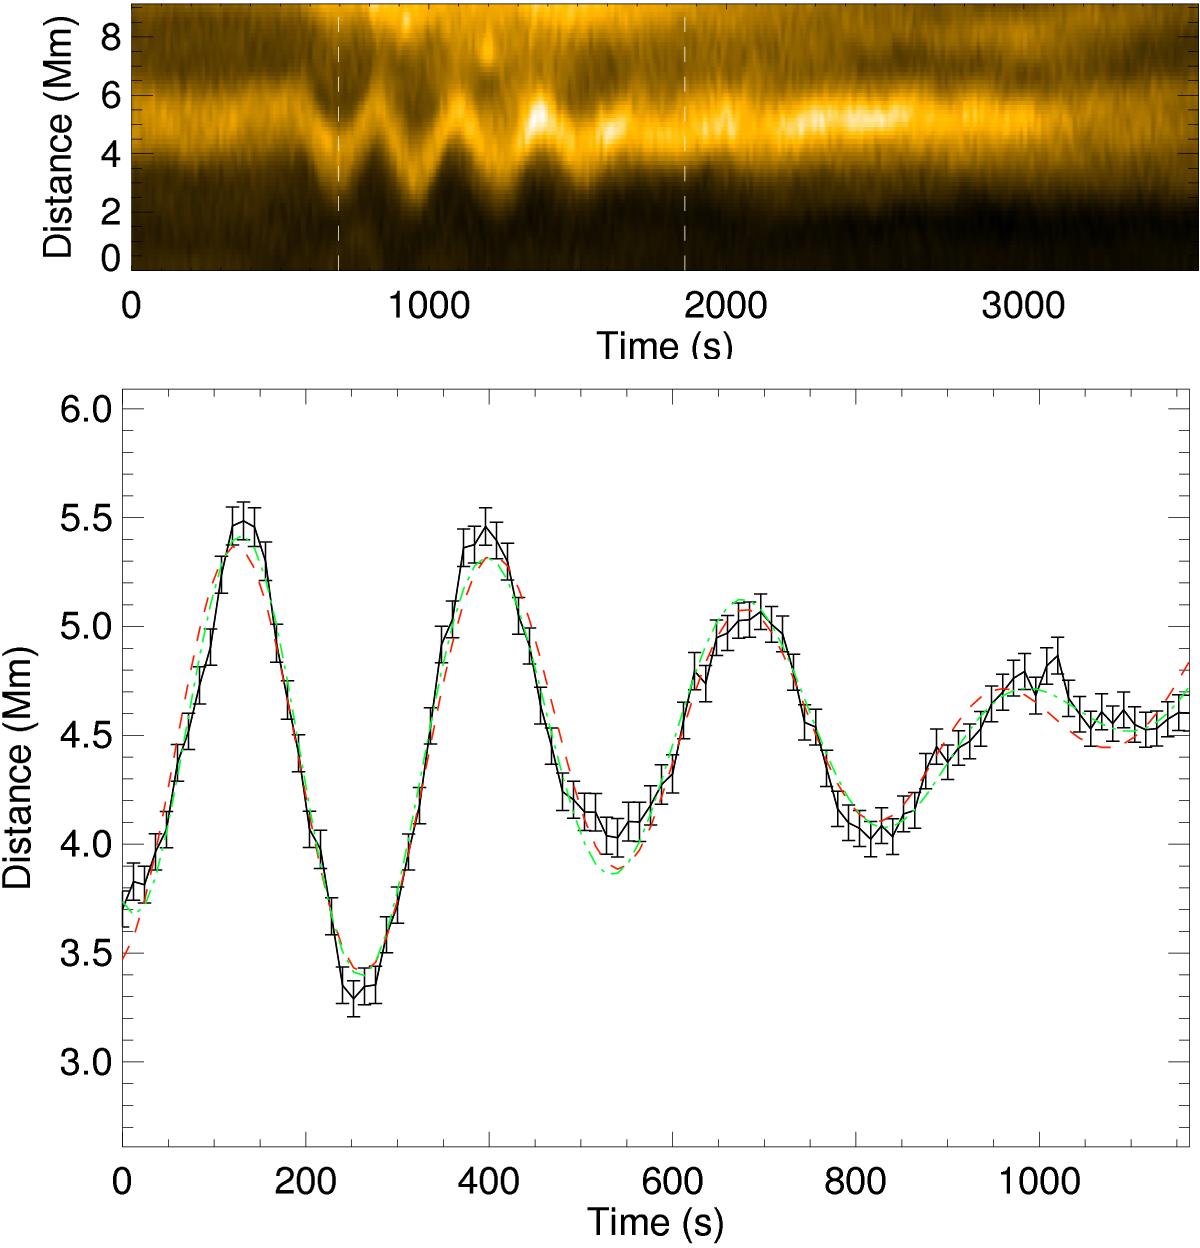
Fig. 2

Model fitting a kink oscillation of a coronal loop. The top panel shows the time-distance diagram for the coronal loop oscillation, where the time shown is in seconds is from 06:29:59 UT. The bottom panel shows the time-series of 97 data points representing the location of the centre of the coronal loop’s cross-sectional flux profile used for the model fitting (solid black curve) with the error bars showing the standard deviation of uncertainties. The time shown is in seconds is from 06:41:23 UT and the corresponding section of the time-distance diagram is highlighted by the dashed white lines in the top panel. The red dashed curve shows the best fit quartic Gaussian model and the green dash-dot curve shows the time-dependant model, f3.
Current usage metrics show cumulative count of Article Views (full-text article views including HTML views, PDF and ePub downloads, according to the available data) and Abstracts Views on Vision4Press platform.
Data correspond to usage on the plateform after 2015. The current usage metrics is available 48-96 hours after online publication and is updated daily on week days.
Initial download of the metrics may take a while.


