Fig. 1
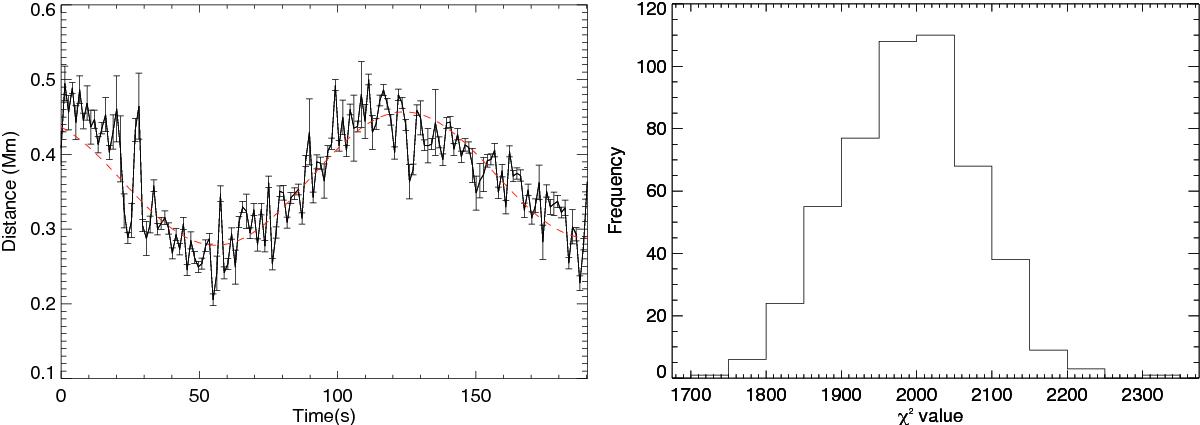
Transverse displacement of a quiescent chromospheric fibril. The time-series of 141 data points represent the location of the centre of the fibrils’ cross-sectional flux profile, with the uncertainties in the location given by the error bars (left panel). The overplotted red dashed line shows the best fit of the model. The distribution of the χ2 statistic for 500 realisations of the random noise in the time-series (right panel).
Current usage metrics show cumulative count of Article Views (full-text article views including HTML views, PDF and ePub downloads, according to the available data) and Abstracts Views on Vision4Press platform.
Data correspond to usage on the plateform after 2015. The current usage metrics is available 48-96 hours after online publication and is updated daily on week days.
Initial download of the metrics may take a while.