Fig. 4
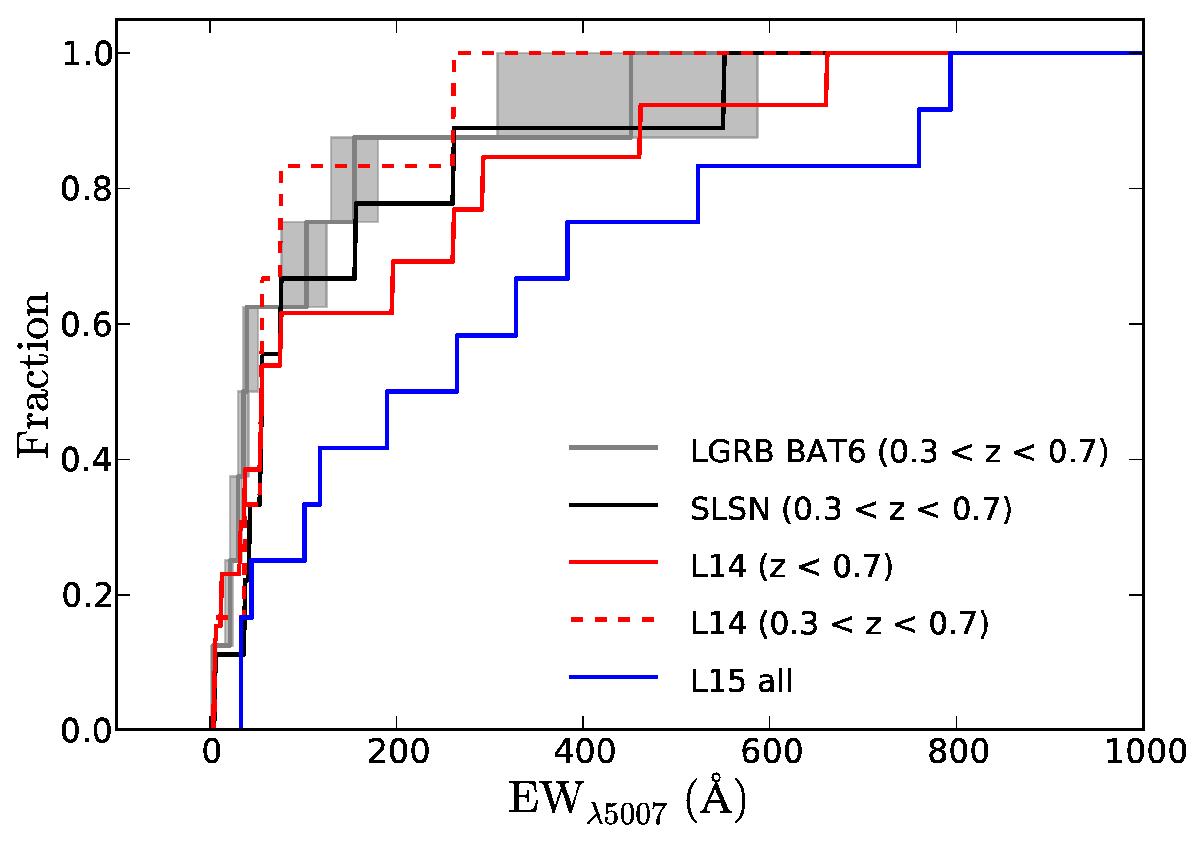
Distributions of equivalent widths of the [O iii]λ5007 emission line. The distribution of 0.3 <z< 0.7 LGRB sample values (grey) is compared to the SLSN sample (Table A.1; black) in the same redshift range. Furthermore, we plot distributions of SLSN samples from the literature, namely from L15 (blue) and L14 (red). Errors are not taken into account in the case of SLSN measurements as they are negligible.
Current usage metrics show cumulative count of Article Views (full-text article views including HTML views, PDF and ePub downloads, according to the available data) and Abstracts Views on Vision4Press platform.
Data correspond to usage on the plateform after 2015. The current usage metrics is available 48-96 hours after online publication and is updated daily on week days.
Initial download of the metrics may take a while.