Free Access
Fig. B.1
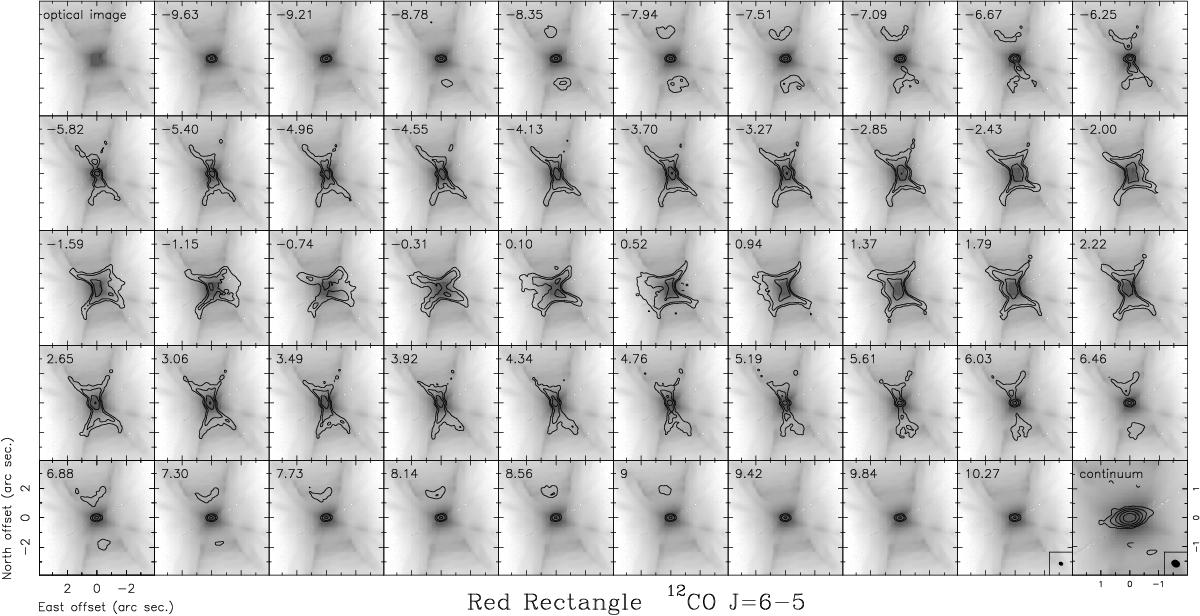
ALMA maps of 12CO J = 6−5, from Bujarrabal et al. (2013b). This figure is reproduced here just to allow comparison with theoretical predictions, Fig. B.2. Continuum is not subtracted in this case because of the intense line emission.
Current usage metrics show cumulative count of Article Views (full-text article views including HTML views, PDF and ePub downloads, according to the available data) and Abstracts Views on Vision4Press platform.
Data correspond to usage on the plateform after 2015. The current usage metrics is available 48-96 hours after online publication and is updated daily on week days.
Initial download of the metrics may take a while.