Fig. 10
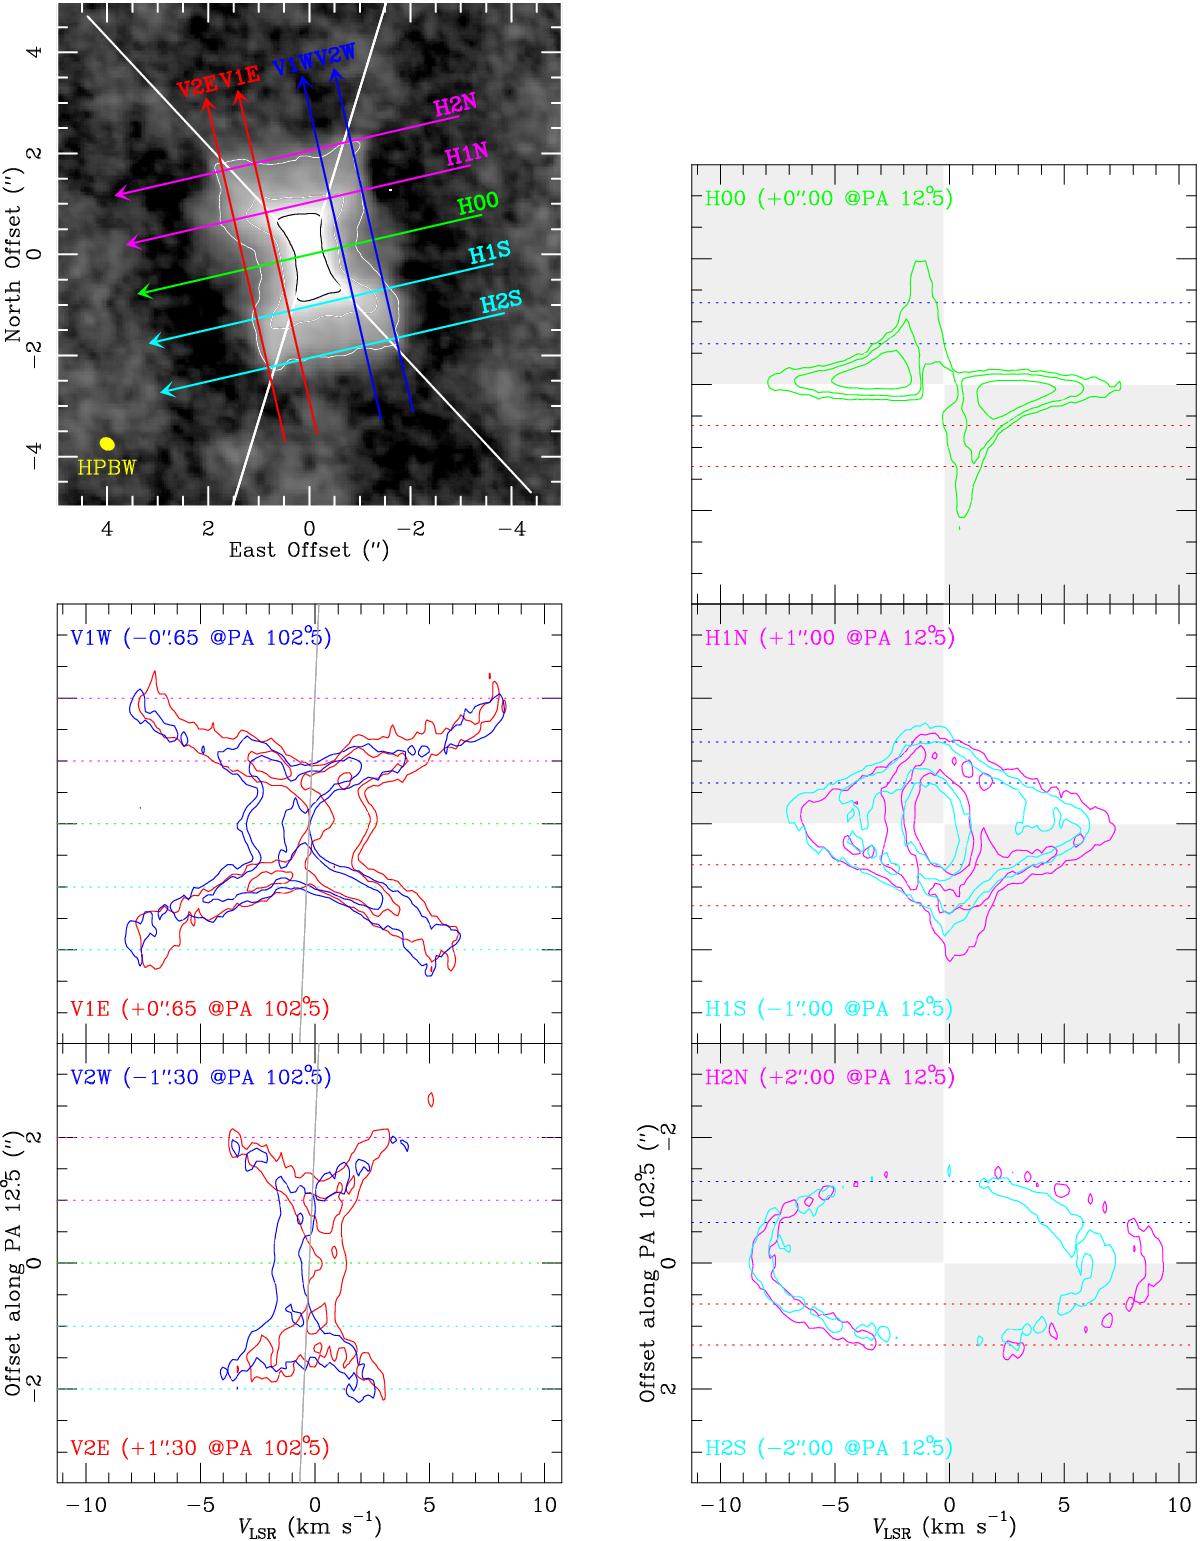
Position-velocity diagrams of 12CO J = 6−5 for several cuts, indicated in the upper left panel, which represents the integrated flux map (the arrows indicate the sense of the offsets in the cuts). The cut positions are also indicated, when appropriate, in other panels. For the integrated flux, the first contour is 20 mJy km s-1, with a logarithmic jump of a factor 3. For the P-V cuts, the contours are always the same as in the corresponding channel maps. The dark areas in the horizontal cuts indicate the P-V quadrants where we expect that emission tends to concentrate in the case of rotation.
Current usage metrics show cumulative count of Article Views (full-text article views including HTML views, PDF and ePub downloads, according to the available data) and Abstracts Views on Vision4Press platform.
Data correspond to usage on the plateform after 2015. The current usage metrics is available 48-96 hours after online publication and is updated daily on week days.
Initial download of the metrics may take a while.