Fig. 5
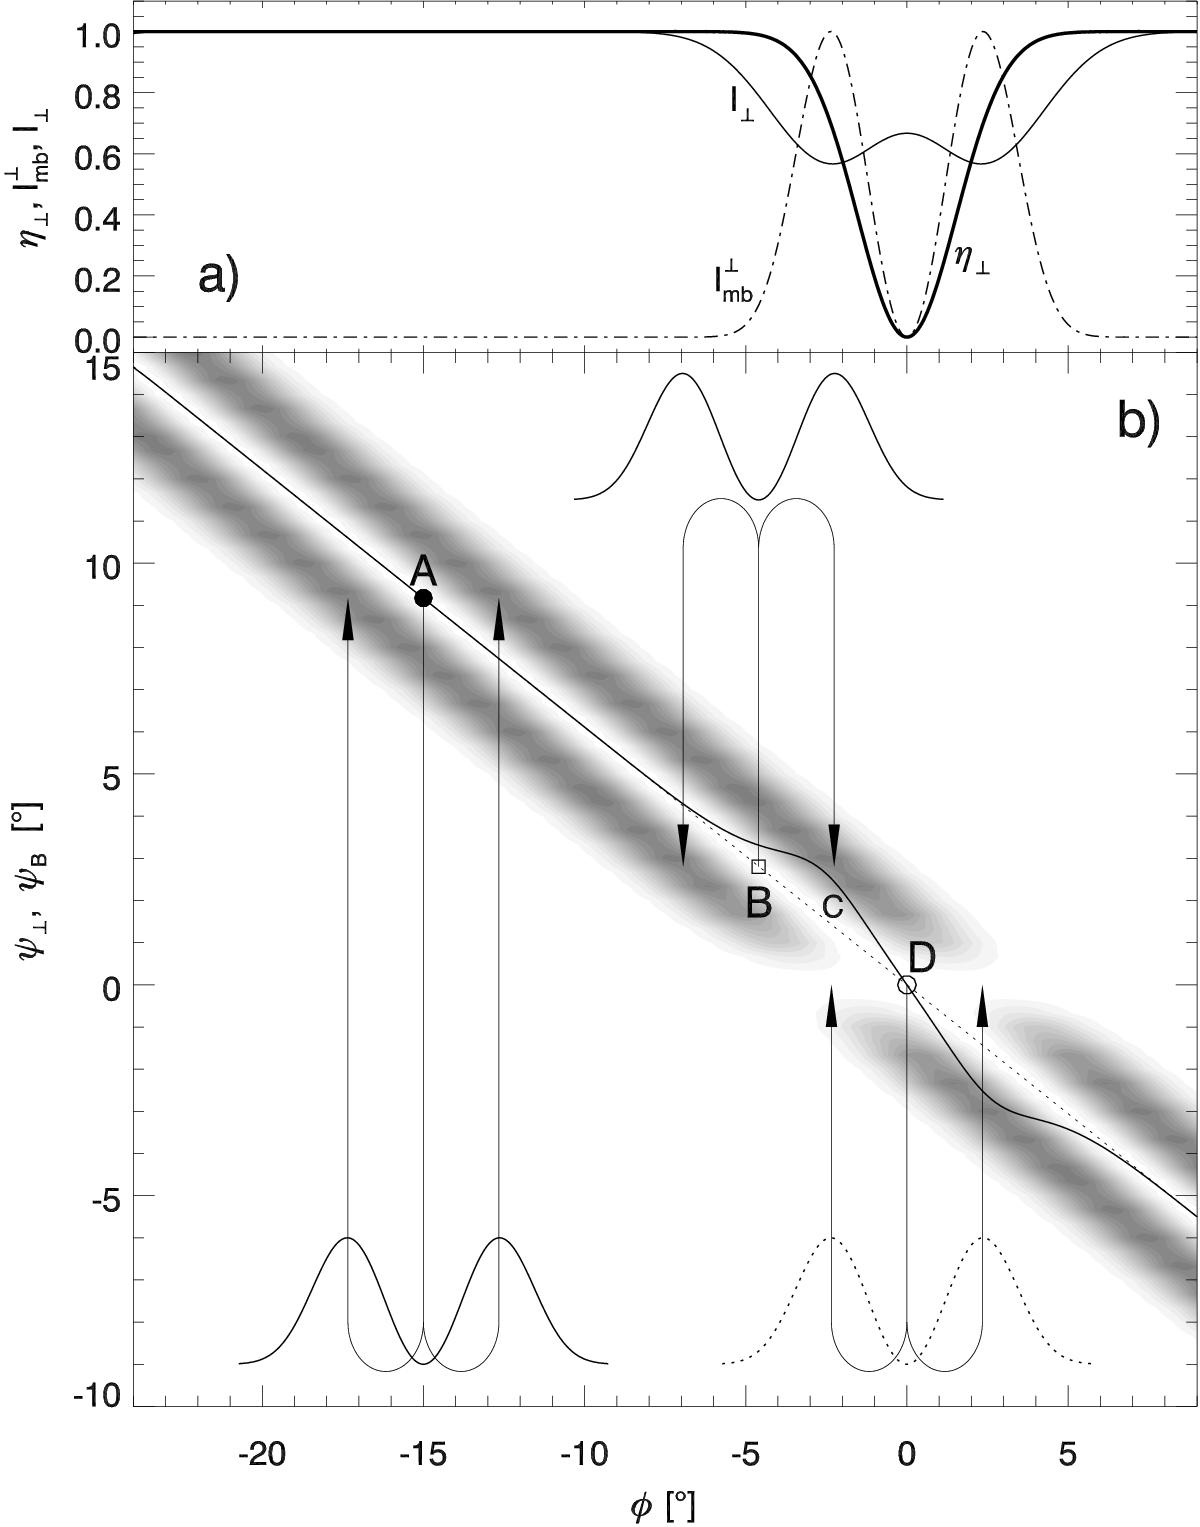
Mechanism of the bidirectional (zigzag-shaped) PA distortion. a) Effective microbeam pattern ![]() (dot-dashed line), and the macroscopic X-mode emissivity η⊥ (thick solid) are convolved into the net intensity profile I⊥ (thin solid). b) PA as a function of phase. The slanted solid line marks ψ⊥, i.e. the net value of the X-mode PA calculated as a fixed-phase average of the bifurcated grey band. The dotted line marks the RVM-based reference (ψB). The double-peaked microbeams, with arrows emerging from points A and B, show how the PA is distributed within the neighbouring pulse longitudes. The void assumed in η⊥ at D (φ = 0) creates the horizontal break in the bifurcated PA band (grey). The resulting imbalance of the PA averaging produces the thick solid PA wiggle.
(dot-dashed line), and the macroscopic X-mode emissivity η⊥ (thick solid) are convolved into the net intensity profile I⊥ (thin solid). b) PA as a function of phase. The slanted solid line marks ψ⊥, i.e. the net value of the X-mode PA calculated as a fixed-phase average of the bifurcated grey band. The dotted line marks the RVM-based reference (ψB). The double-peaked microbeams, with arrows emerging from points A and B, show how the PA is distributed within the neighbouring pulse longitudes. The void assumed in η⊥ at D (φ = 0) creates the horizontal break in the bifurcated PA band (grey). The resulting imbalance of the PA averaging produces the thick solid PA wiggle.
Current usage metrics show cumulative count of Article Views (full-text article views including HTML views, PDF and ePub downloads, according to the available data) and Abstracts Views on Vision4Press platform.
Data correspond to usage on the plateform after 2015. The current usage metrics is available 48-96 hours after online publication and is updated daily on week days.
Initial download of the metrics may take a while.