Fig. 13
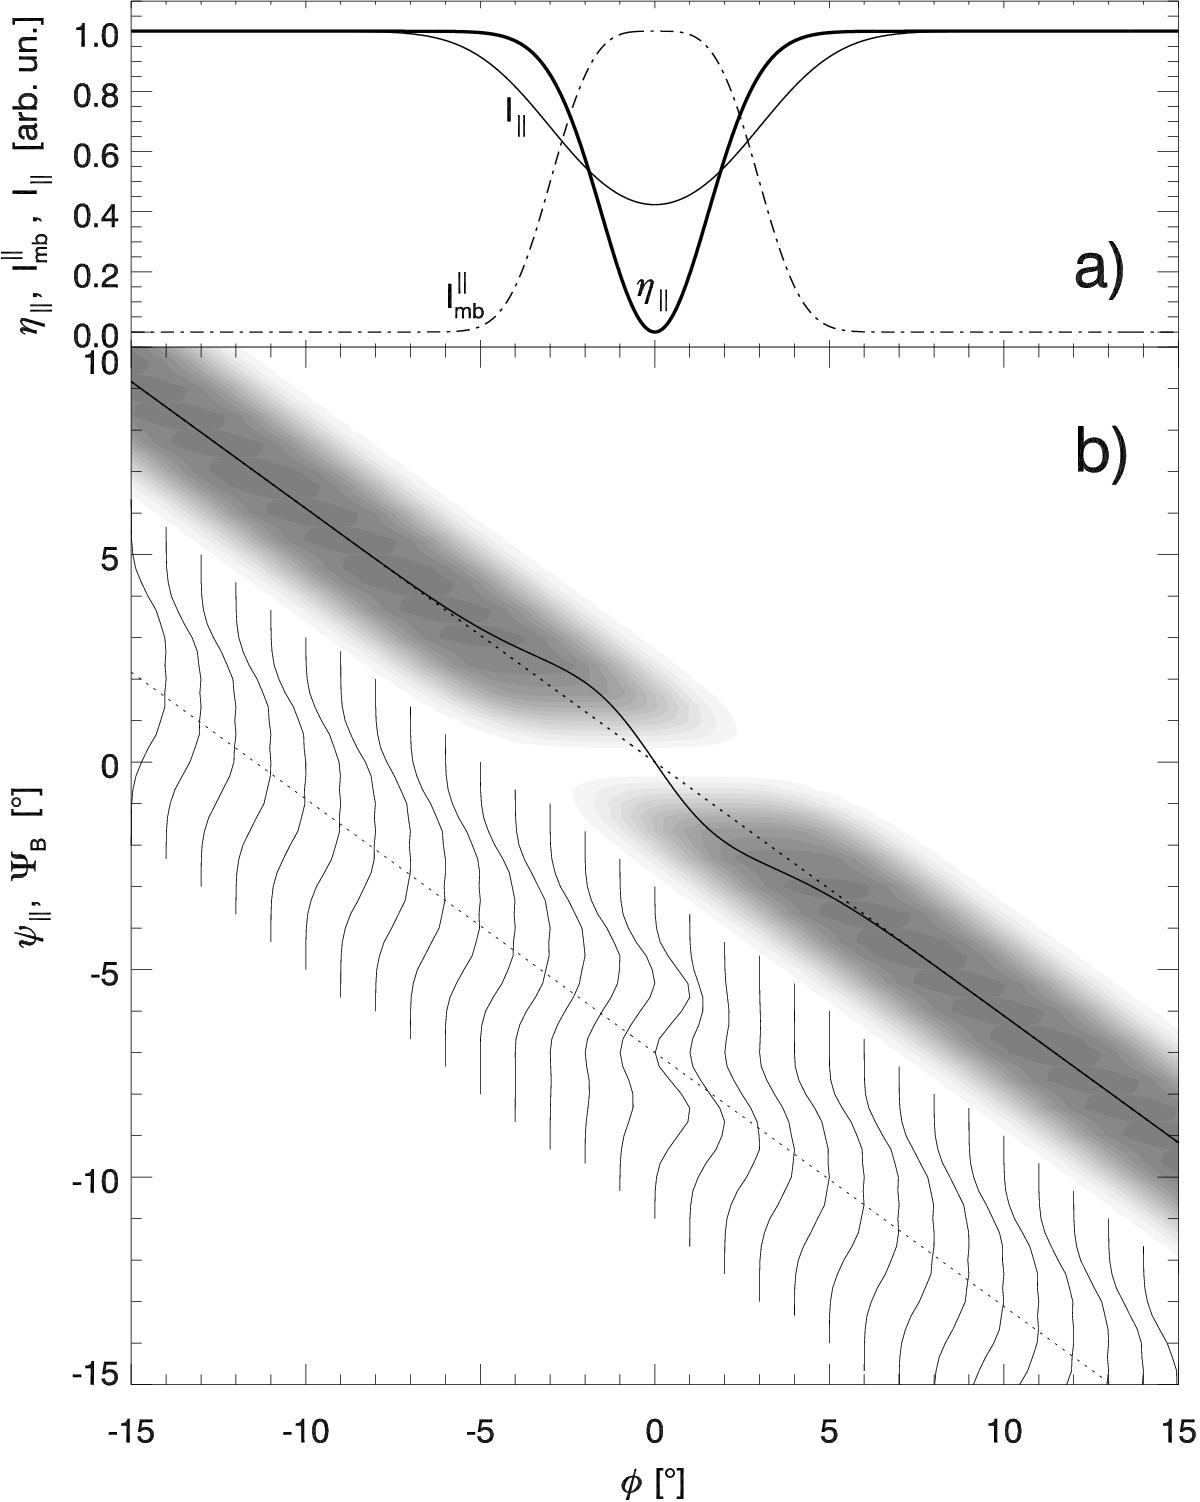
Origin of the zigzag-shaped PA wiggle in the case of the filled-in microbeam of the O-mode. The layout is similar to that of Fig. 5, except for the fixed-phase PA distributions which are plotted at 1° phase intervals in panel b). The minimum in η∥ produces the single-minimum dip in the net O-mode intensity (I∥, thin solid line in a)) as well as the blank gap in the non-bifurcated grey PA band (panel b)). The PA wiggle is again produced by the imbalance of the PA averaging.
Current usage metrics show cumulative count of Article Views (full-text article views including HTML views, PDF and ePub downloads, according to the available data) and Abstracts Views on Vision4Press platform.
Data correspond to usage on the plateform after 2015. The current usage metrics is available 48-96 hours after online publication and is updated daily on week days.
Initial download of the metrics may take a while.