Fig. 12
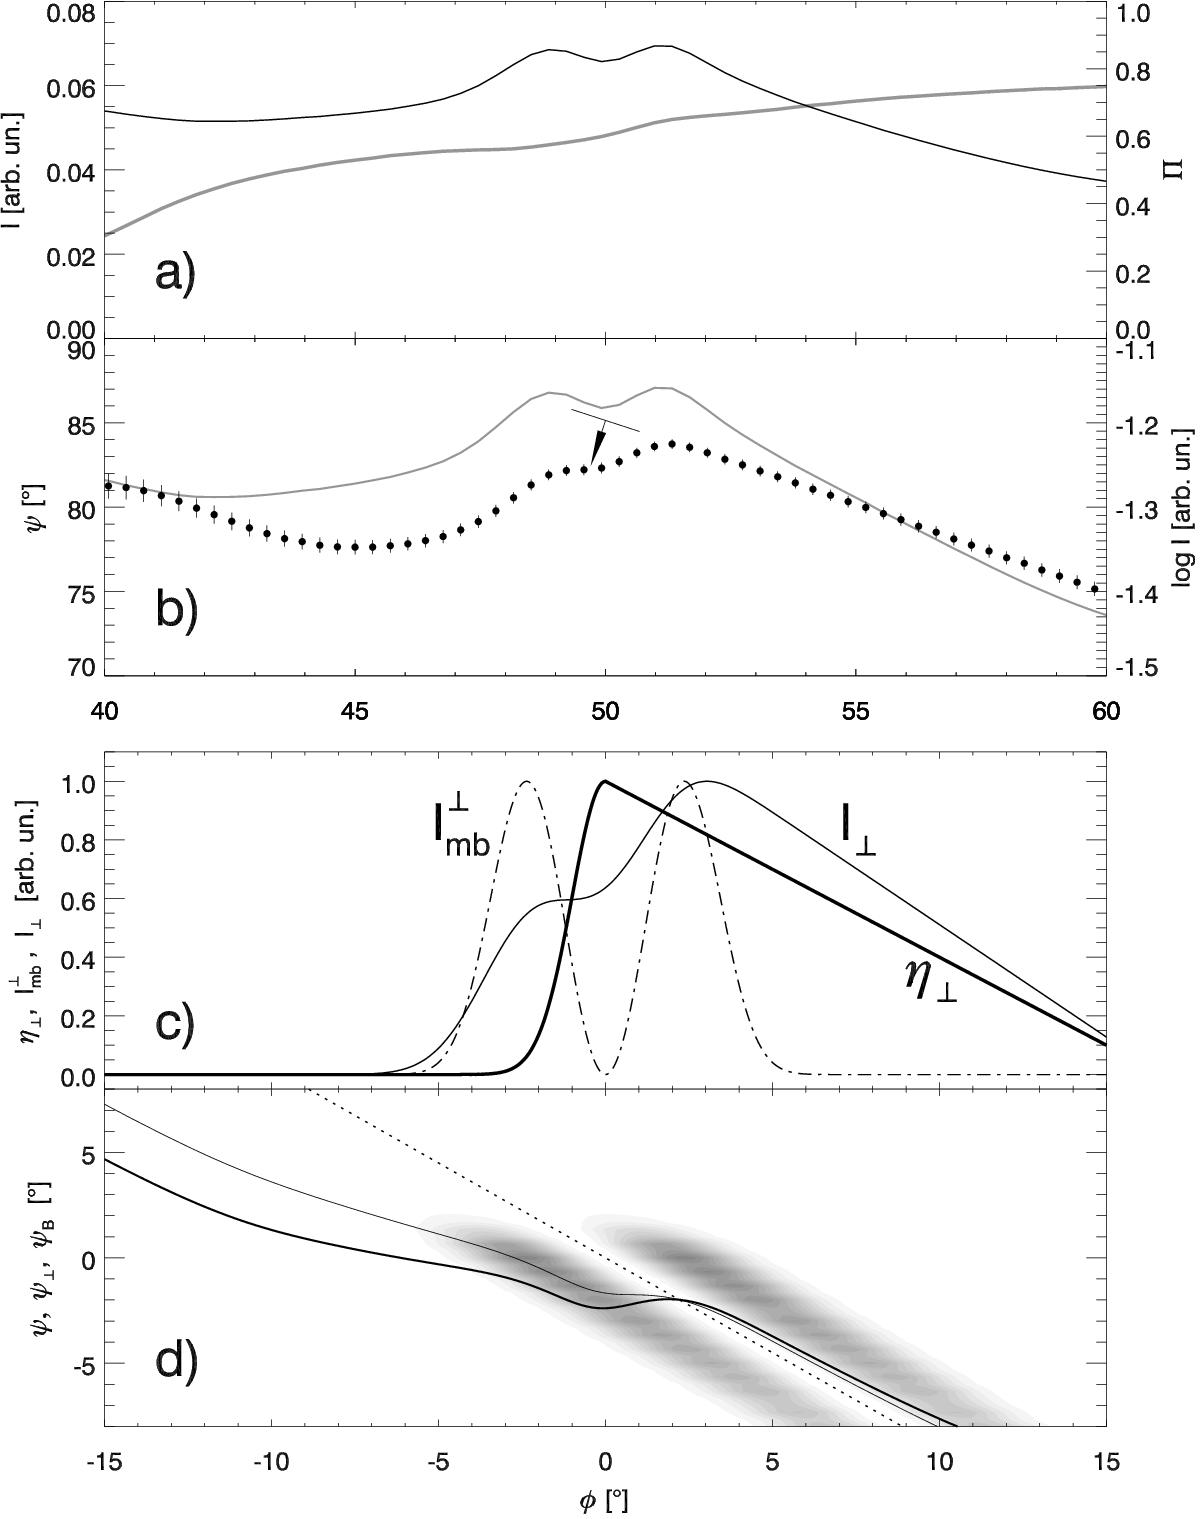
Comparison of the observed (panels a) and b)) and modelled (c) and d)) properties of the bifurcated trailing component (BTC) in J0437−4715. The observed properties (I and Π in a); ψ and log I in b)) present a zoomed part of Fig. 3. The arrow in b marks a step-like change in PA at the centre of the BTC (the PA is shown with dots). A similar step-like change in PA (solid lines in panel d) occurs for a one-sided emissivity profile (η⊥, thick solid in c)) which is decreasing gradually (linearly) on the right-hand side, but much more steeply on the left-hand side (a half-Gaussian with ση = 1°). The thin solid line in d) presents ψ⊥, whereas the thick line presents ψ obtained for a fixed fractional contribution of the O-mode: I∥ = 0.3I⊥(φ). This is an exemplary result obtained for ψB = −0.9φ, ρcrv = 5 × 104 cm.
Current usage metrics show cumulative count of Article Views (full-text article views including HTML views, PDF and ePub downloads, according to the available data) and Abstracts Views on Vision4Press platform.
Data correspond to usage on the plateform after 2015. The current usage metrics is available 48-96 hours after online publication and is updated daily on week days.
Initial download of the metrics may take a while.