Fig. 1
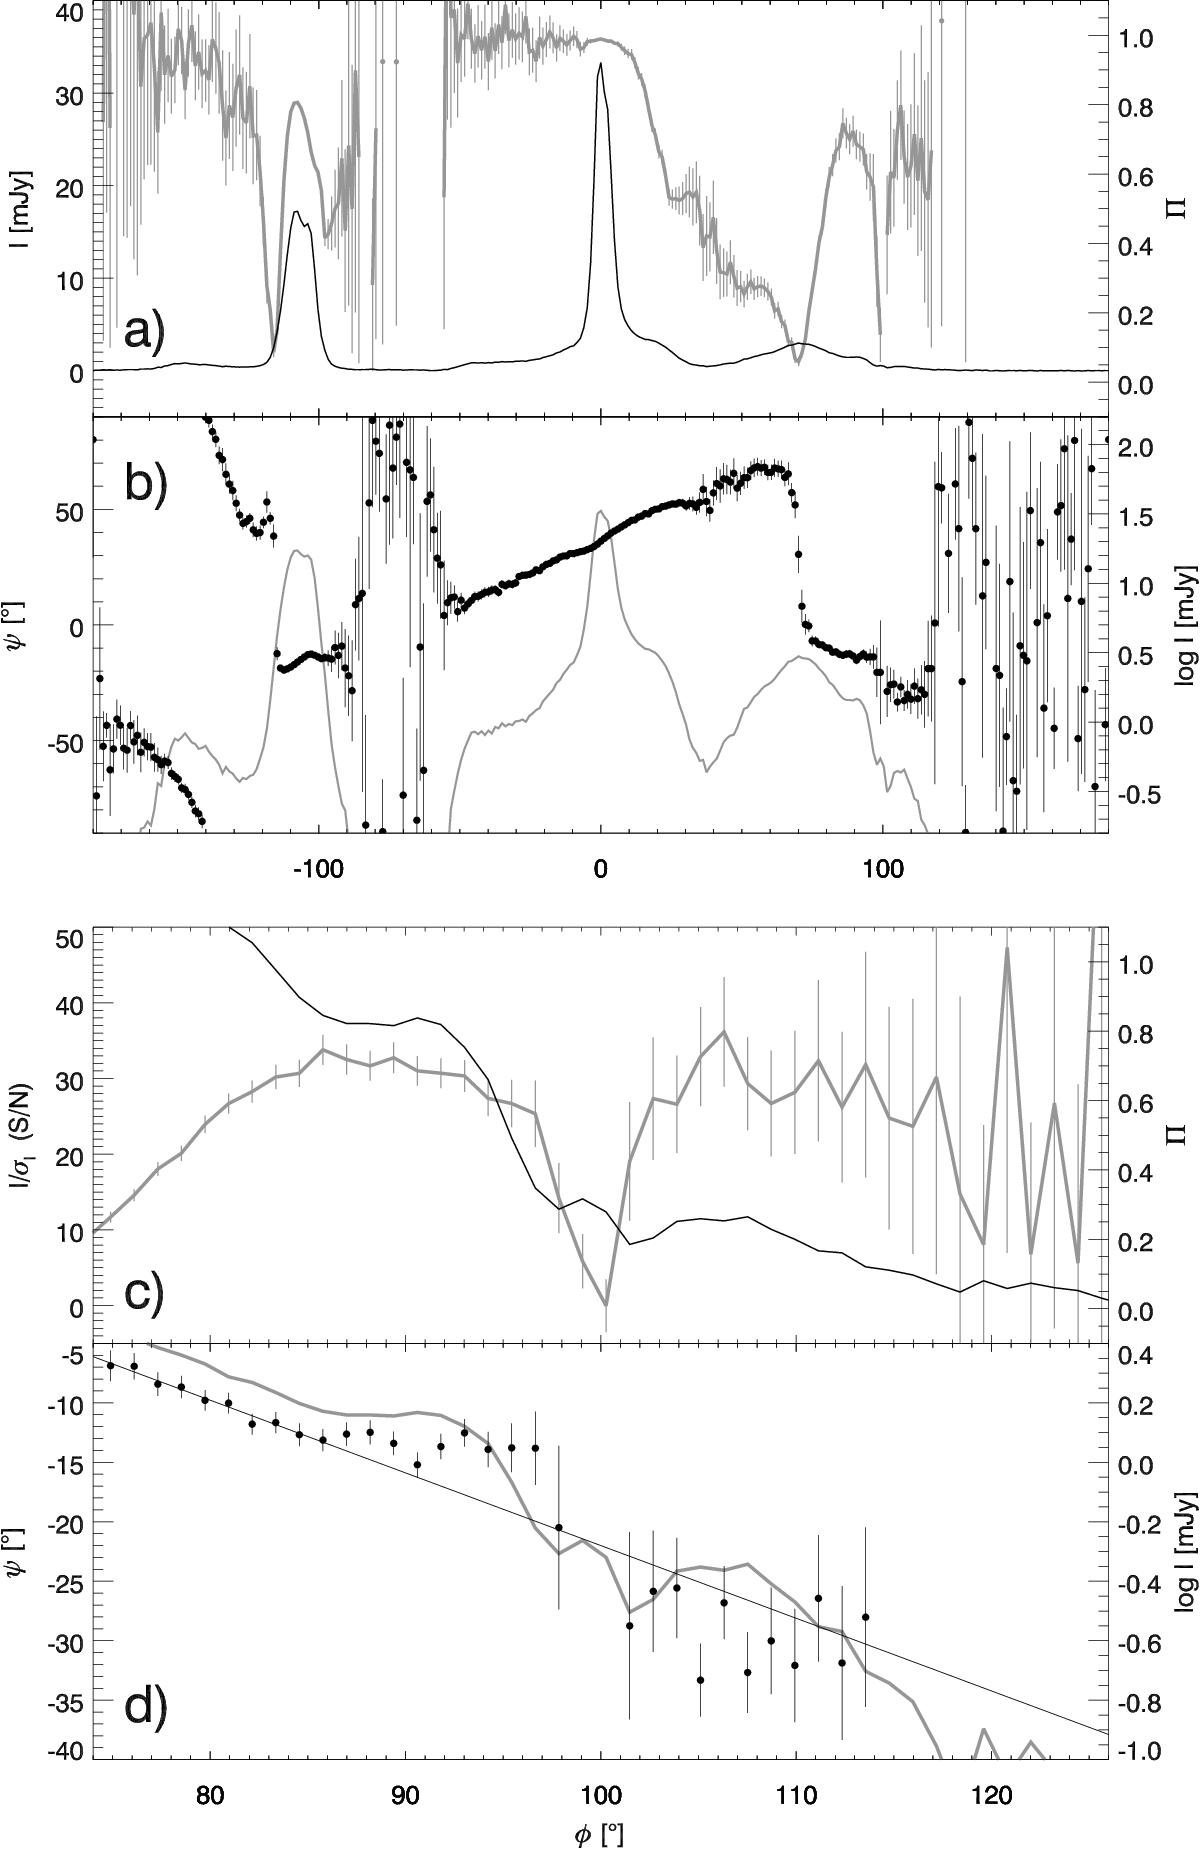
Linear polarisation properties of PSR B1821−24A as observed with GBT in L-band (BPDR). Grey curves refer to the vertical axes on the right-hand side. The bottom two panels zoom into the double notches at φ ≈ 100°. a) Total flux I (black solid) and the linear polarisation fraction Π = L/I (grey). b) The PA (black) and log I (grey). c) The total flux S/N (black solid) and the polarisation fraction (grey). d) The PA (black) and log I (grey). The straight line presents the PA variations anticipated in the absence of the notches. There is a drop in Π and a change in PA at the notches. The zero point of PA (whether observed or modelled) is arbitrary in all figures of this paper.
Current usage metrics show cumulative count of Article Views (full-text article views including HTML views, PDF and ePub downloads, according to the available data) and Abstracts Views on Vision4Press platform.
Data correspond to usage on the plateform after 2015. The current usage metrics is available 48-96 hours after online publication and is updated daily on week days.
Initial download of the metrics may take a while.