Free Access
Fig. A.4
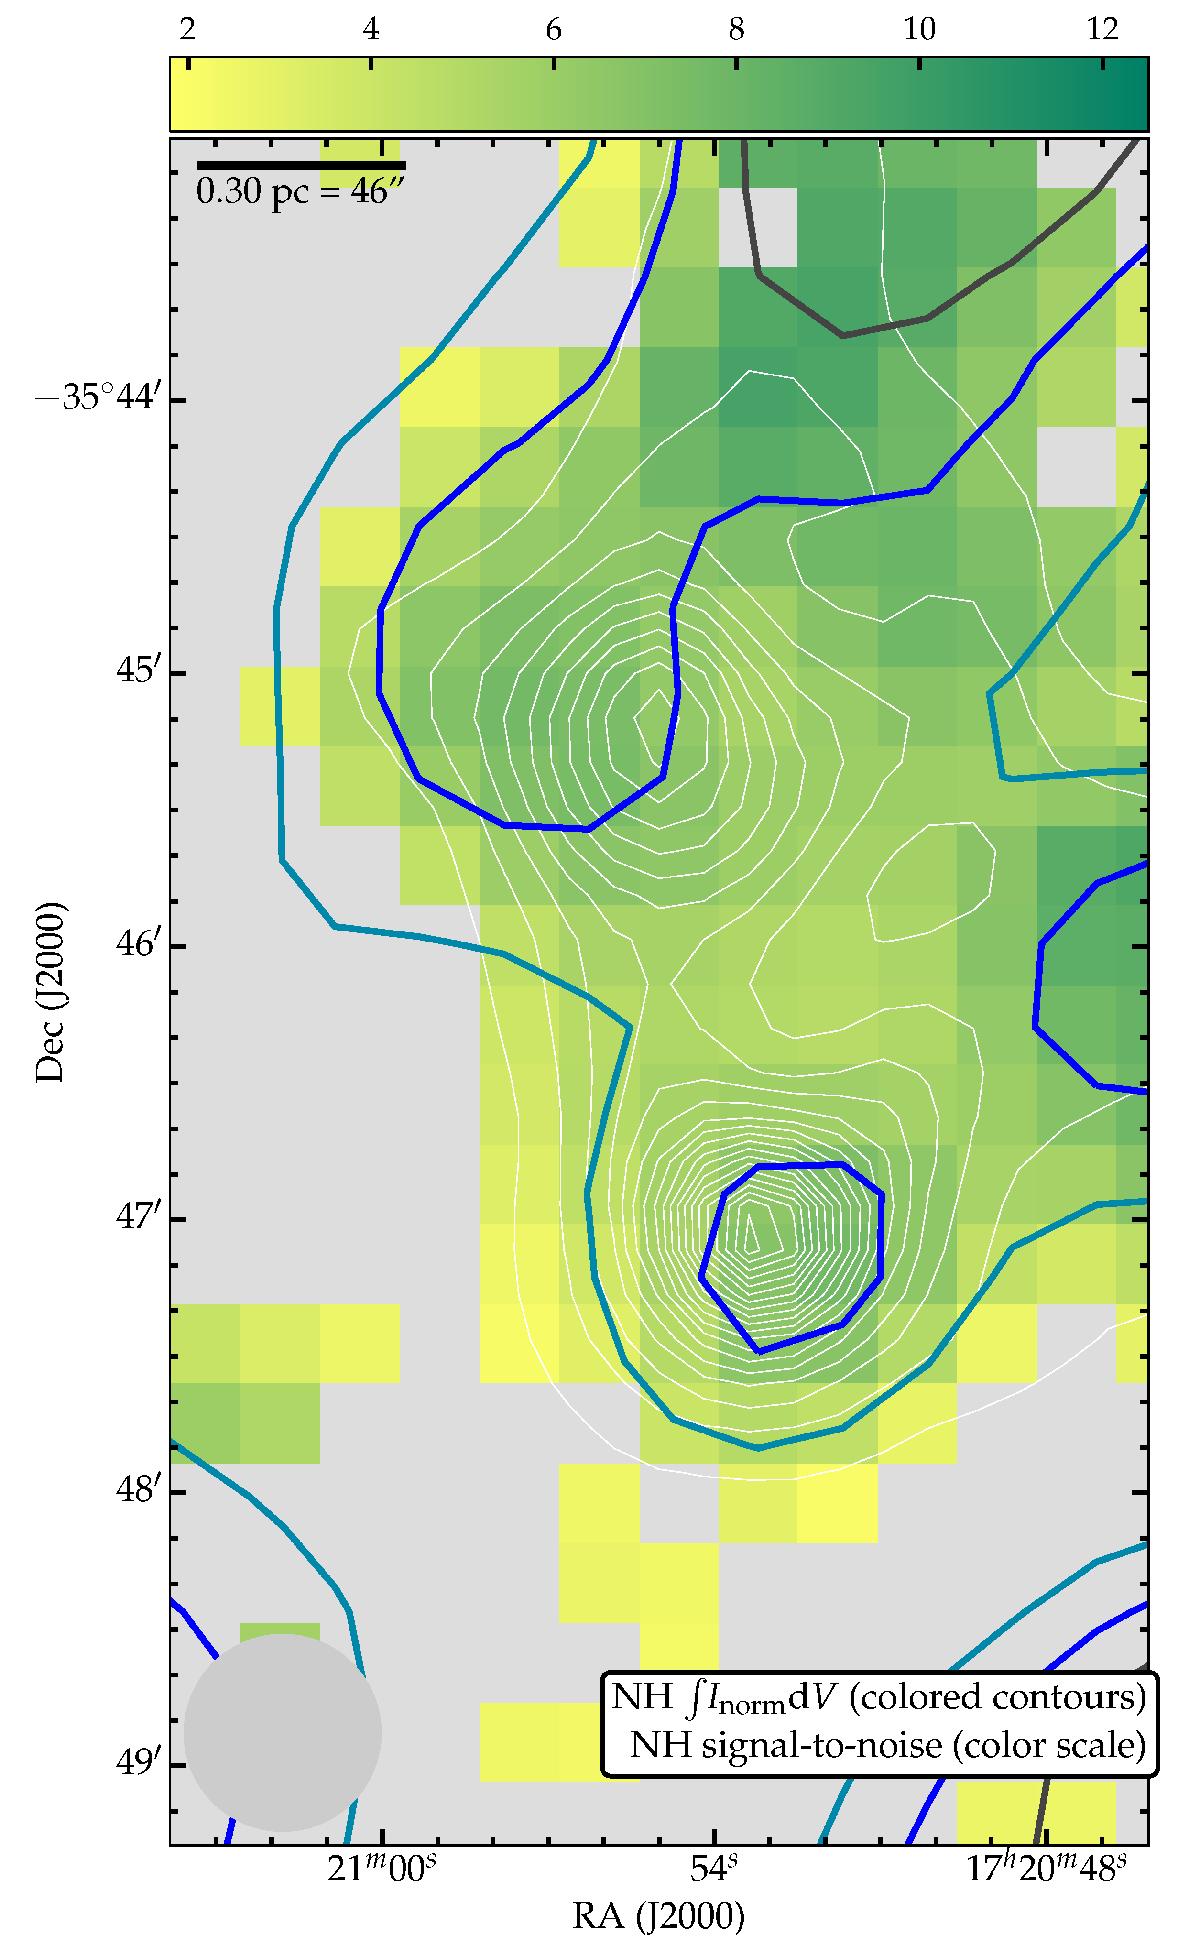
As in Fig. A.2, but for the J = 2 ← 1 N = 1 ← 0 transition of NH at 974.47 GHz. The J = 1–1 transition at 1000.0 GHz shows a similar absorption distribution, but with detections in fewer pixels. Colored contours are at 16.5, 13.5, and 10.5 km s-1 in gray, blue, and cyan, respectively.
Current usage metrics show cumulative count of Article Views (full-text article views including HTML views, PDF and ePub downloads, according to the available data) and Abstracts Views on Vision4Press platform.
Data correspond to usage on the plateform after 2015. The current usage metrics is available 48-96 hours after online publication and is updated daily on week days.
Initial download of the metrics may take a while.