Free Access
Fig. A.2
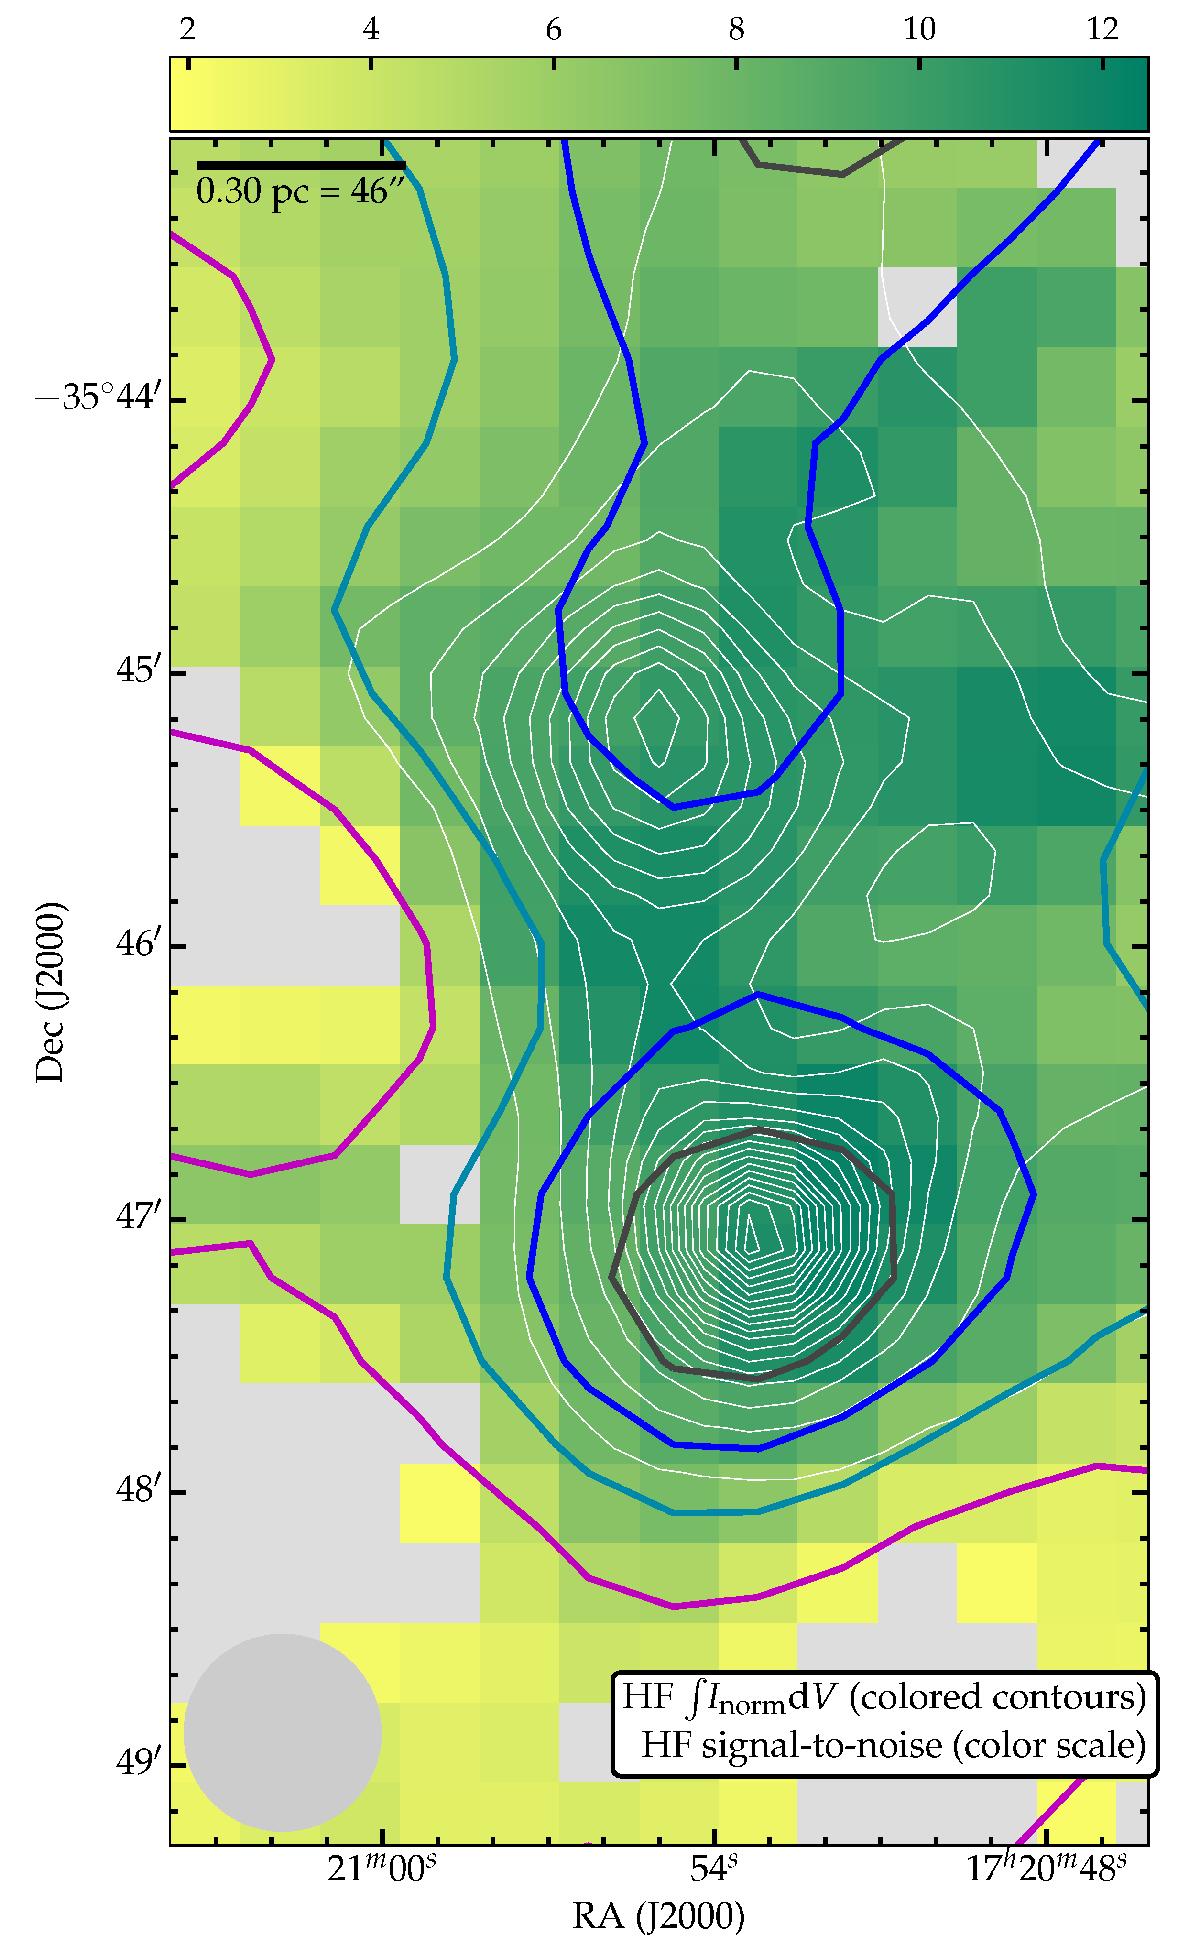
Signal-to-noise maps (color scale, with gray indicating values below 2) of the absorption signature of HF 1 ← 0. Colored contours are at the same equivalent width levels as in Fig. 3. As in Fig. 3, white contours trace continuum dust emission and the beam of the SPIRE iFTS map is shown in the bottom left corner.
Current usage metrics show cumulative count of Article Views (full-text article views including HTML views, PDF and ePub downloads, according to the available data) and Abstracts Views on Vision4Press platform.
Data correspond to usage on the plateform after 2015. The current usage metrics is available 48-96 hours after online publication and is updated daily on week days.
Initial download of the metrics may take a while.