Fig. A.1
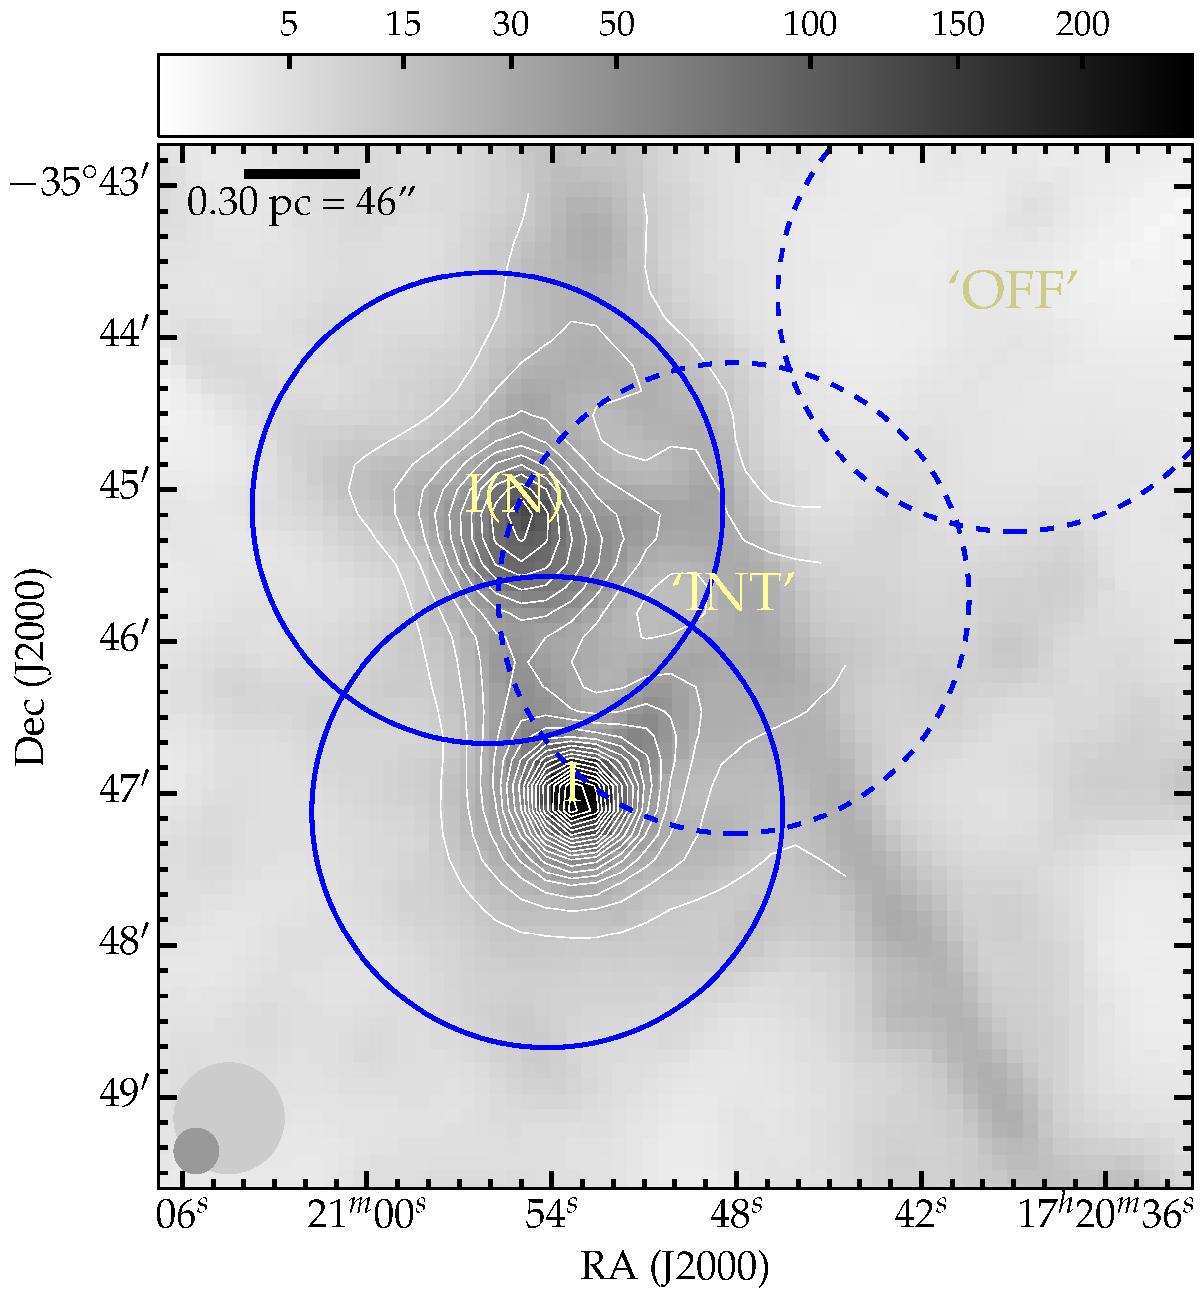
Placement of the SPIRE iFTS footprints on the NGC 6334 region (cf. Table 1). Solid circles indicate the fully sampled observations, two centered on cores I and one on I(N), while the sparsely sampled “INT” and “OFF” observations are represented by dashed circles. Circles are drawn with a diameter of 3.́1 to include the vignetted outer ring of the detector arrays (SPIRE Handbook. 2014, Herschel-HSC-DOC-0798, version 2.5). The grayscale represents the same 250 μm dust continuum map as in Fig. 3, but with the scale bar stretching from 1 to 250 GJy sr-1. The thin white contours, the beam size indicators in the bottom left, and the scale bar in the top left corners are the same as in Fig. 3.
Current usage metrics show cumulative count of Article Views (full-text article views including HTML views, PDF and ePub downloads, according to the available data) and Abstracts Views on Vision4Press platform.
Data correspond to usage on the plateform after 2015. The current usage metrics is available 48-96 hours after online publication and is updated daily on week days.
Initial download of the metrics may take a while.