Fig. 5
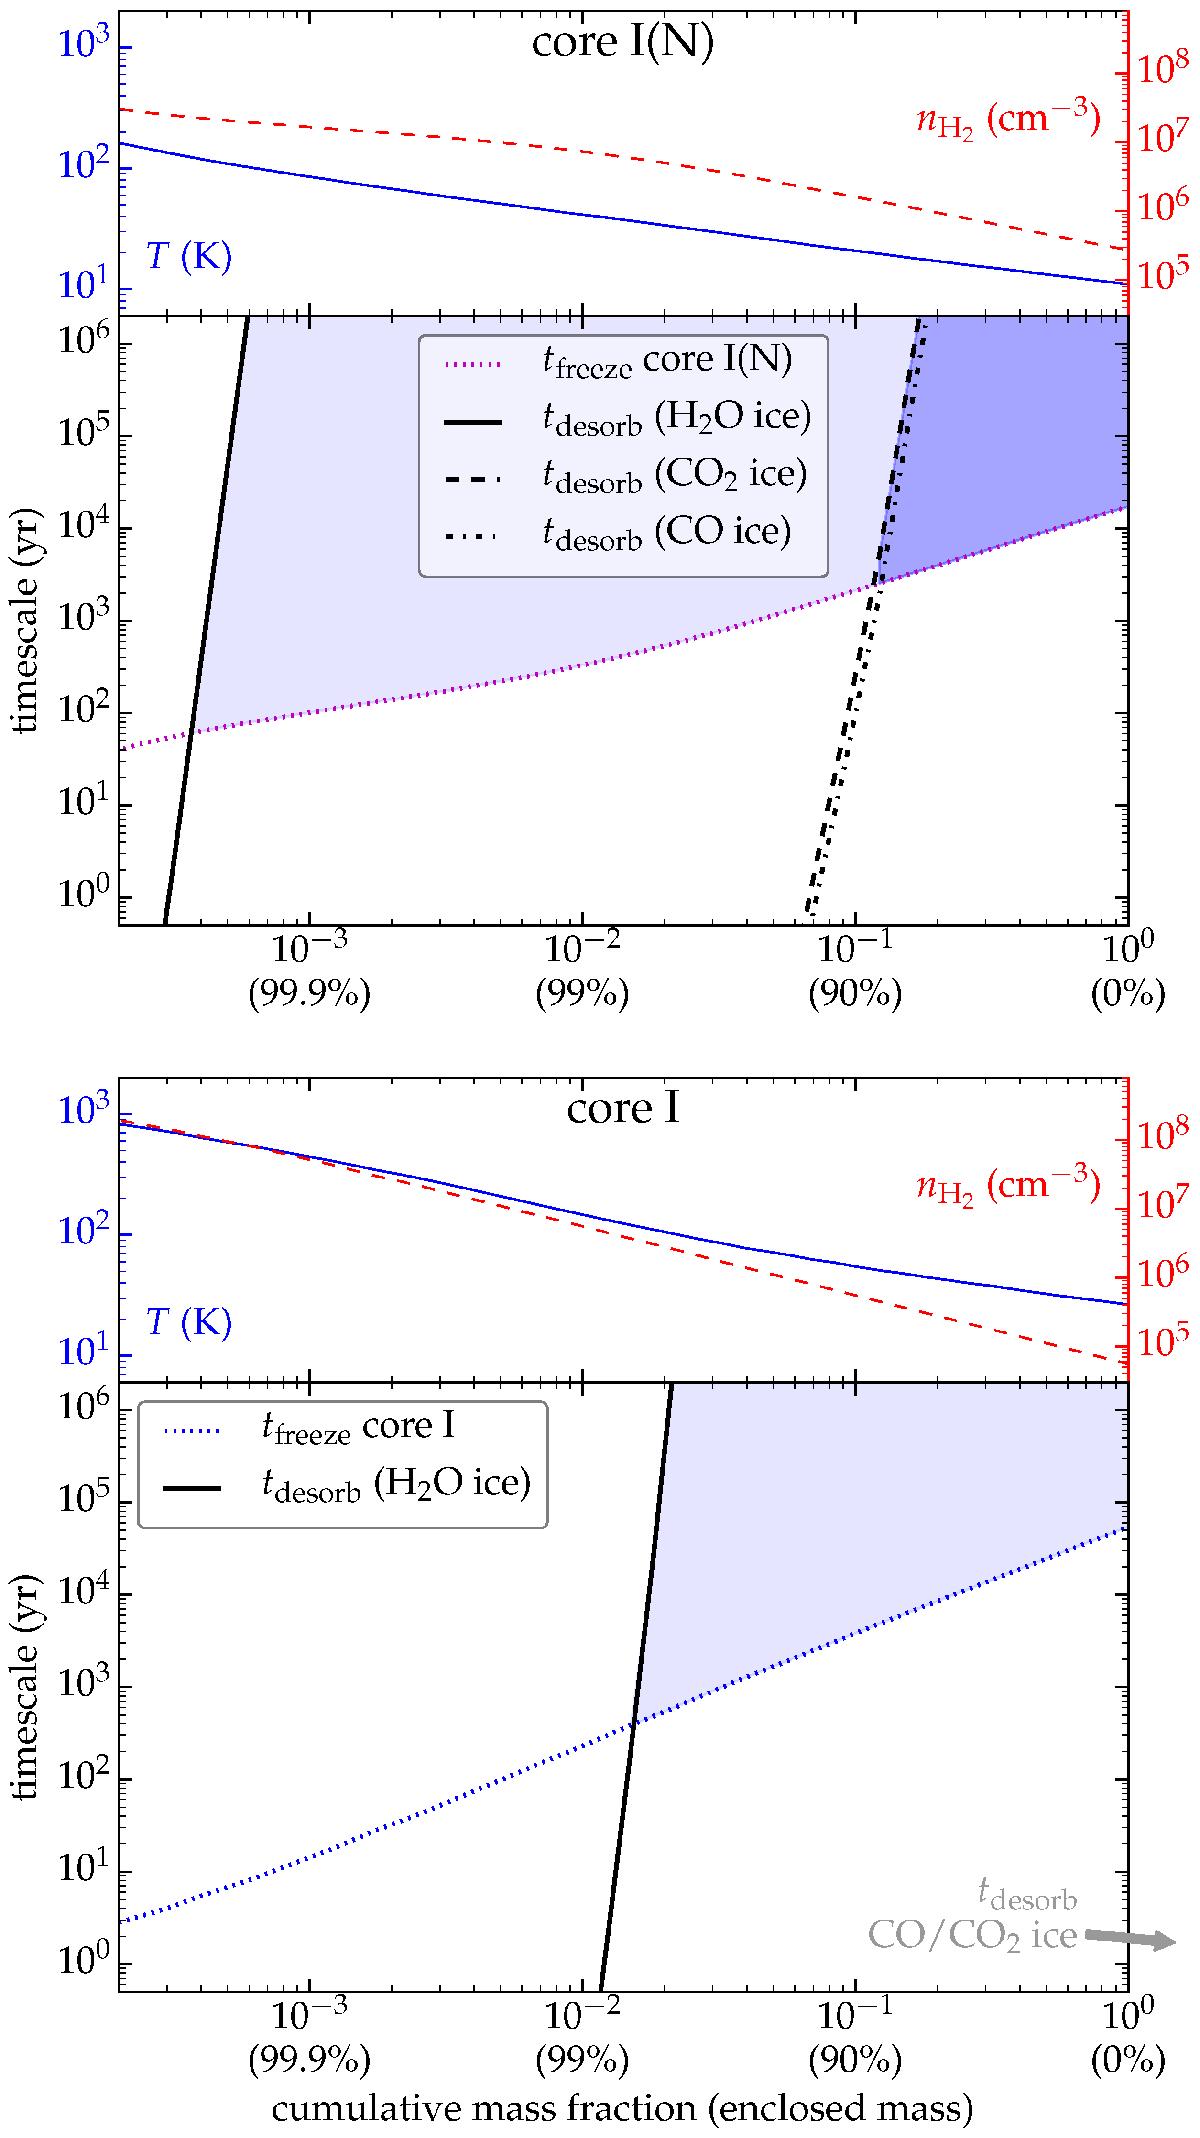
Radial dependence of adsorption and desorption timescales of HF from various types of grain surfaces. The top half of the figure relates to the envelope of core I(N), the bottom half to that of core I. The small panels above each main panel depict the physical structure (temperature in solid blue, left axis; density in dashed red, right axis) for the envelopes in question from Van der Tak et al. (2013). The horizontal axis is logarithmic cumulative mass increasing from left to right; labels in brackets indicate the percentage of enclosed mass starting from the outer shell of the core. Freeze-out of HF (depletion from the gas phase) occurs in the region where tdesorb>tfreeze; light shading indicates the case of H2O ice mantles, darker shading that of CO/CO2 ice mantles. The desorption timescale lines for CO ice and CO2 ice in the bottom panel lie to the far right, outside of the limits of the axes.
Current usage metrics show cumulative count of Article Views (full-text article views including HTML views, PDF and ePub downloads, according to the available data) and Abstracts Views on Vision4Press platform.
Data correspond to usage on the plateform after 2015. The current usage metrics is available 48-96 hours after online publication and is updated daily on week days.
Initial download of the metrics may take a while.