Fig. 3
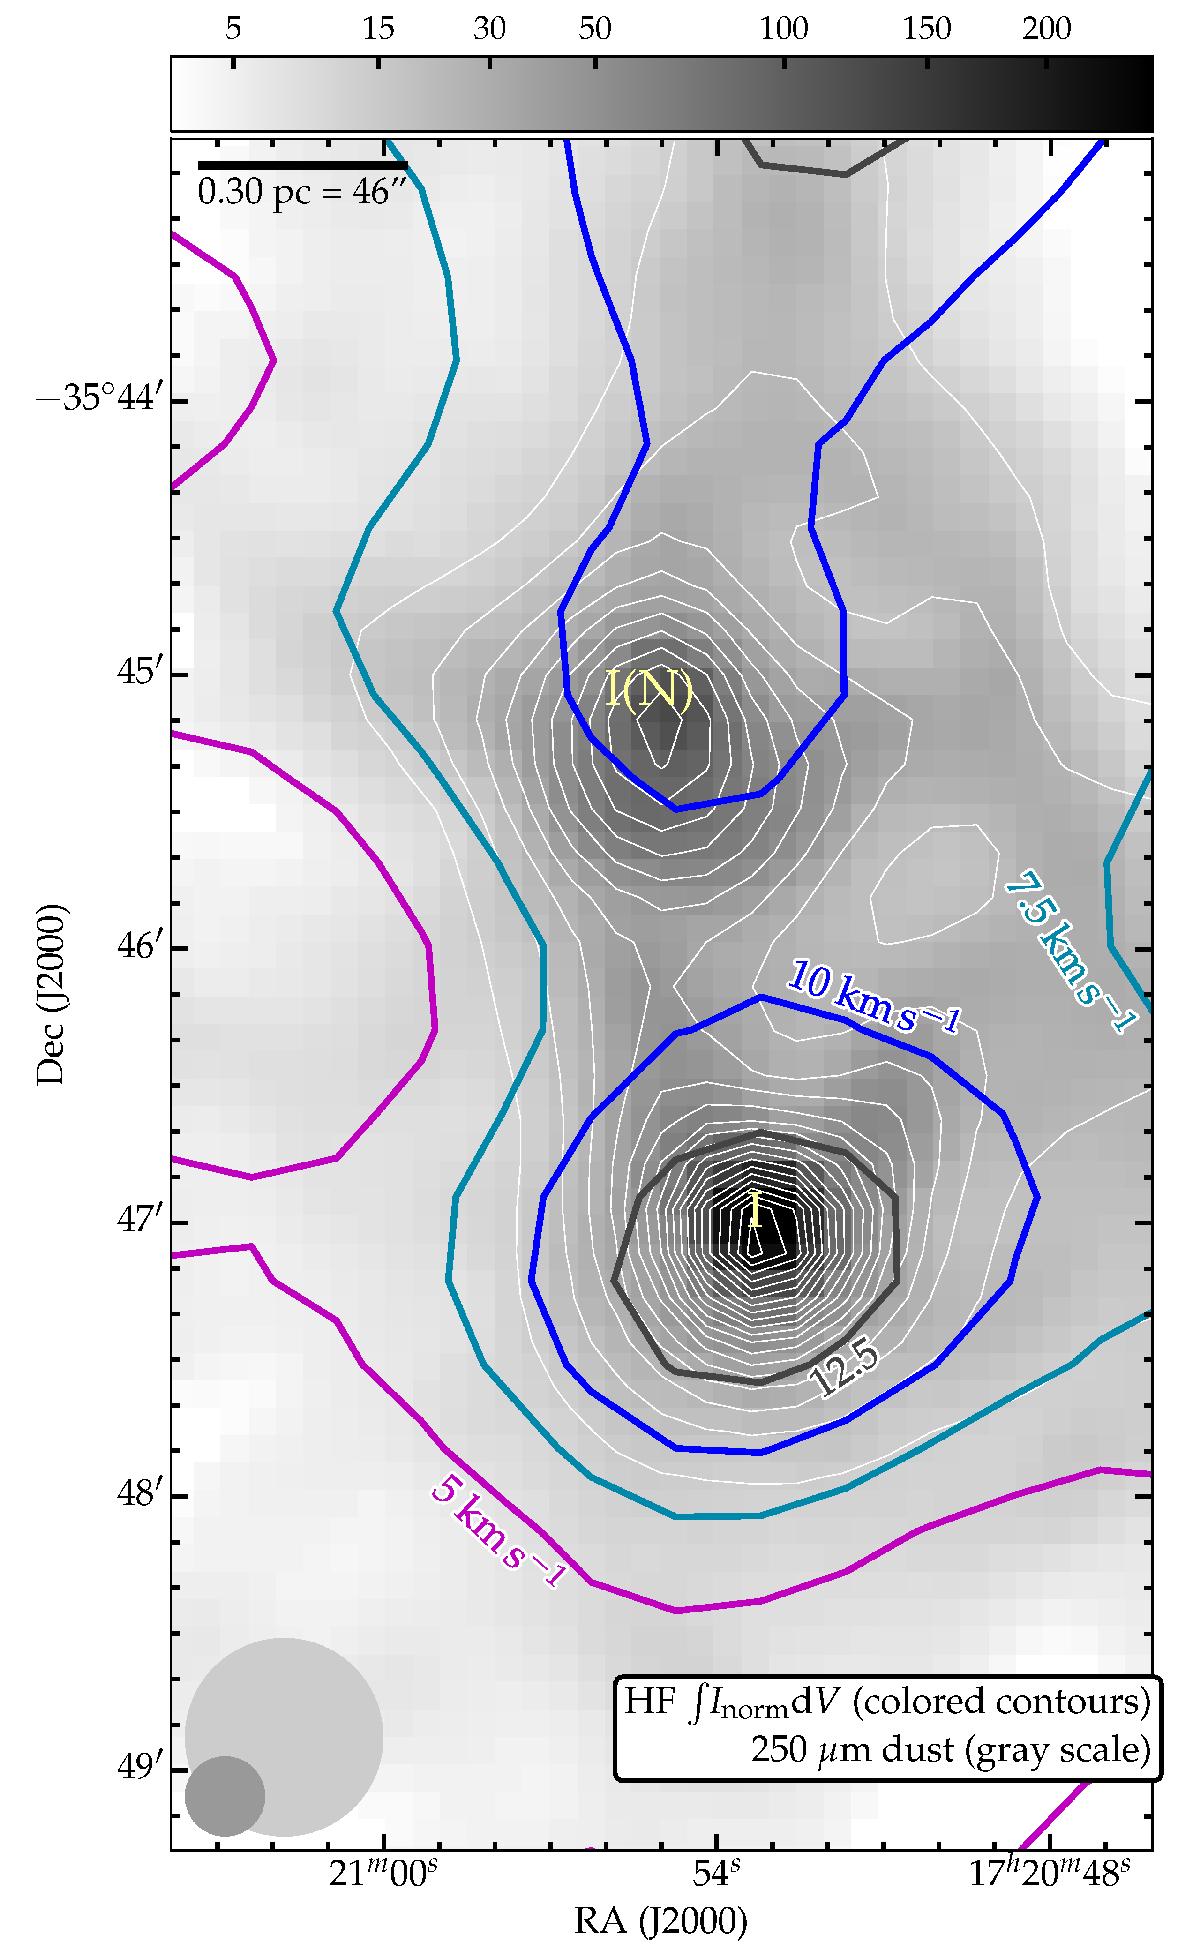
Map of equivalent width of the HF 1 ← 0 absorption signature measured with Herschel SPIRE iFTS (colored contours). The peak value in the center of the “12.5 km s-1” contour is 16 km s-1. The grayscale represents 250 μm dust continuum emission measured with the SPIRE photometer (Herschel observation ID 1342239909, HIPE 13 standard pipeline, color bar stretched from 4 to 250 GJy sr-1). The thin white contours are from the continuum as measured by the FTS, which closely follow the structure seen in the photometer grayscale map. Beam sizes of the convolved spectrometer cube and photometer map are shown in the bottom left corner in light gray and dark gray circles, respectively. The scale bar in the top left corner indicates a projected length of 0.3 pc at a distance to the source of 1.35 kpc.
Current usage metrics show cumulative count of Article Views (full-text article views including HTML views, PDF and ePub downloads, according to the available data) and Abstracts Views on Vision4Press platform.
Data correspond to usage on the plateform after 2015. The current usage metrics is available 48-96 hours after online publication and is updated daily on week days.
Initial download of the metrics may take a while.