Fig. 2
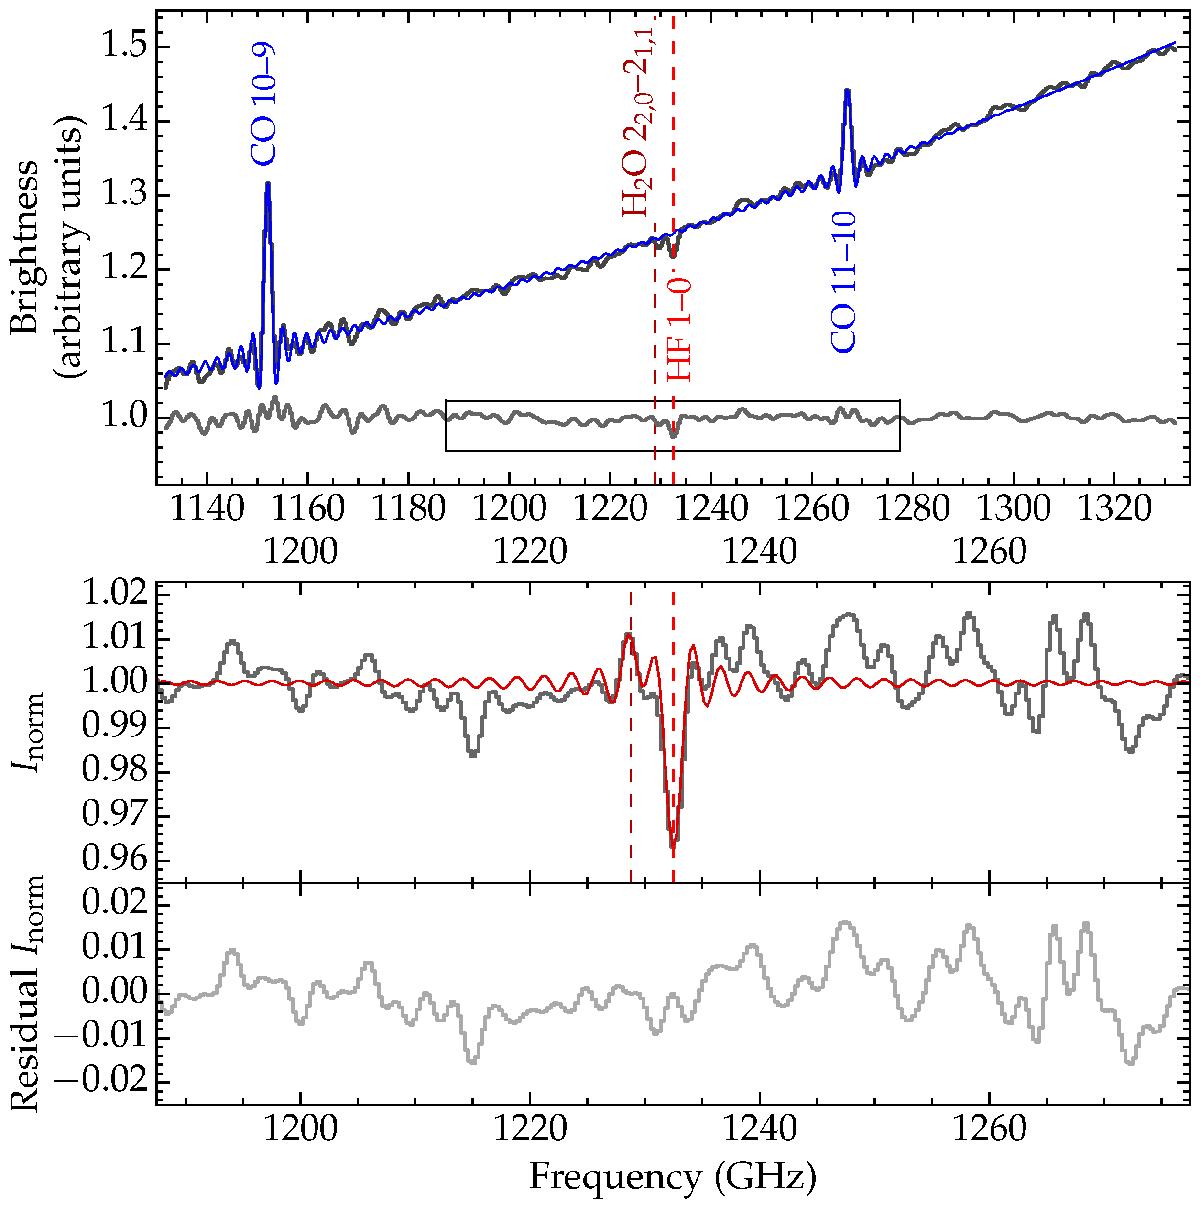
Illustration of the procedure adopted to fit the spectrally unresolved, sinc-shaped absorption line feature in the SPIRE iFTS cube. Rest frequencies of the relevant transitions are marked by vertical dashed lines. Top panel: observed spectrum (black) toward one of the pixels in our map, fit to continuum and CO lines (blue), and the resulting ratio spectrum (gray). The rectangular box denotes the axes limits of the next panel. Middle panel: zoom of continuum-normalized spectrum (gray, same as top panel) and fit to the combined signature of the HF absorption line and the nearby H2O emission line (red). Bottom panel: residual remaining after subtracting the fit shown in the middle panel.
Current usage metrics show cumulative count of Article Views (full-text article views including HTML views, PDF and ePub downloads, according to the available data) and Abstracts Views on Vision4Press platform.
Data correspond to usage on the plateform after 2015. The current usage metrics is available 48-96 hours after online publication and is updated daily on week days.
Initial download of the metrics may take a while.