Fig. 5
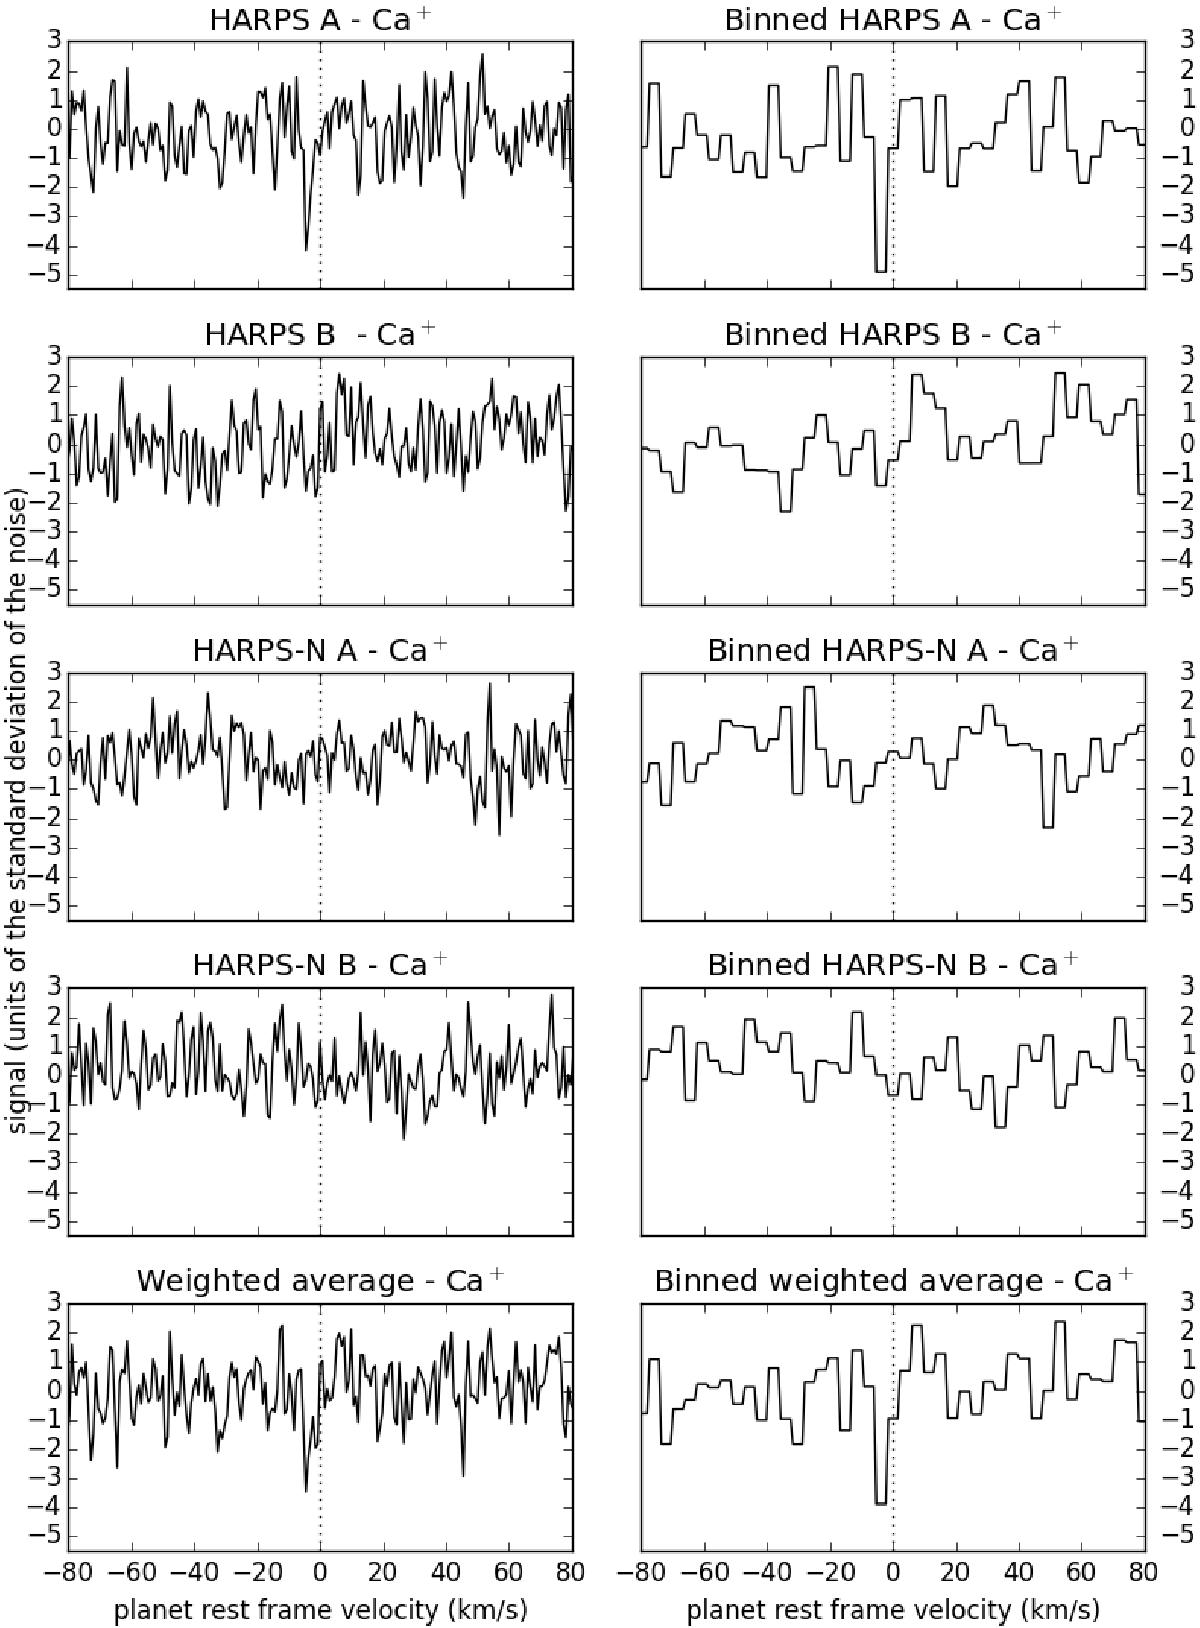
Signal of ionized calcium from the individual data sets and from an average of the data sets, weighted according to the S/N of the data set. The signals have been scaled to be in units of the standard deviation of the noise. The left column is not binned while the right column is binned every 0.05 Å or 3.8 km s-1. The vertical dotted line in all panels indicates a planet rest frame velocity of 0 km s-1. The binned average signal has a detection S/N = 4.1; however, this completely originates from the HARPS A data set which individually has a binned detection S/N of 4.9.
Current usage metrics show cumulative count of Article Views (full-text article views including HTML views, PDF and ePub downloads, according to the available data) and Abstracts Views on Vision4Press platform.
Data correspond to usage on the plateform after 2015. The current usage metrics is available 48-96 hours after online publication and is updated daily on week days.
Initial download of the metrics may take a while.