Fig. 10
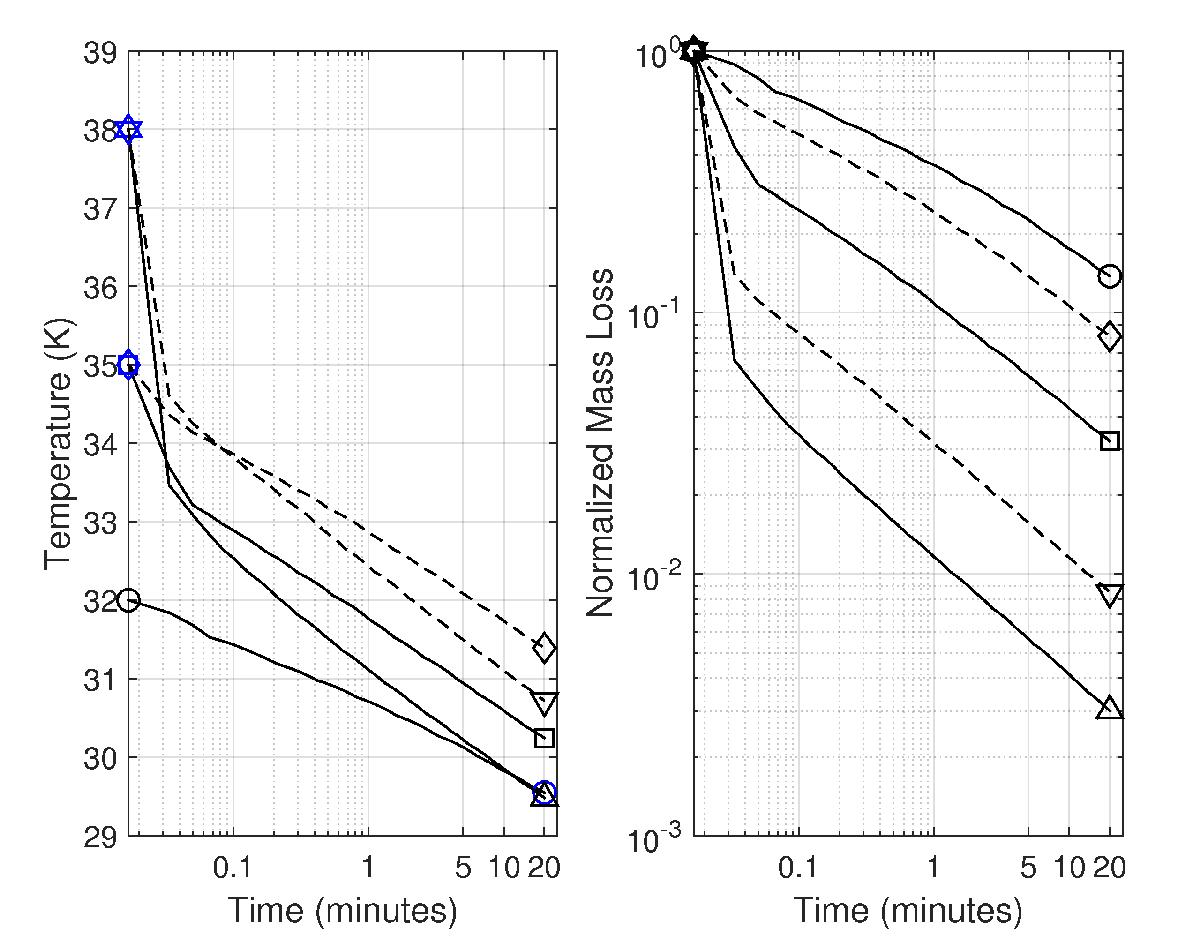
Left panel: time evolution of external boundary temperature during active sublimation of super-volatile ice (CO) triggered by the deepening crack. Solid curves: the effective thermal conductivity corresponds to the thermal inertia equal to the most probable value (MIRO). Dashed curves: the effective thermal conductivity is increased ten times. Right panel: same for the case of relative mass loss.
Current usage metrics show cumulative count of Article Views (full-text article views including HTML views, PDF and ePub downloads, according to the available data) and Abstracts Views on Vision4Press platform.
Data correspond to usage on the plateform after 2015. The current usage metrics is available 48-96 hours after online publication and is updated daily on week days.
Initial download of the metrics may take a while.