Free Access
Fig. 1
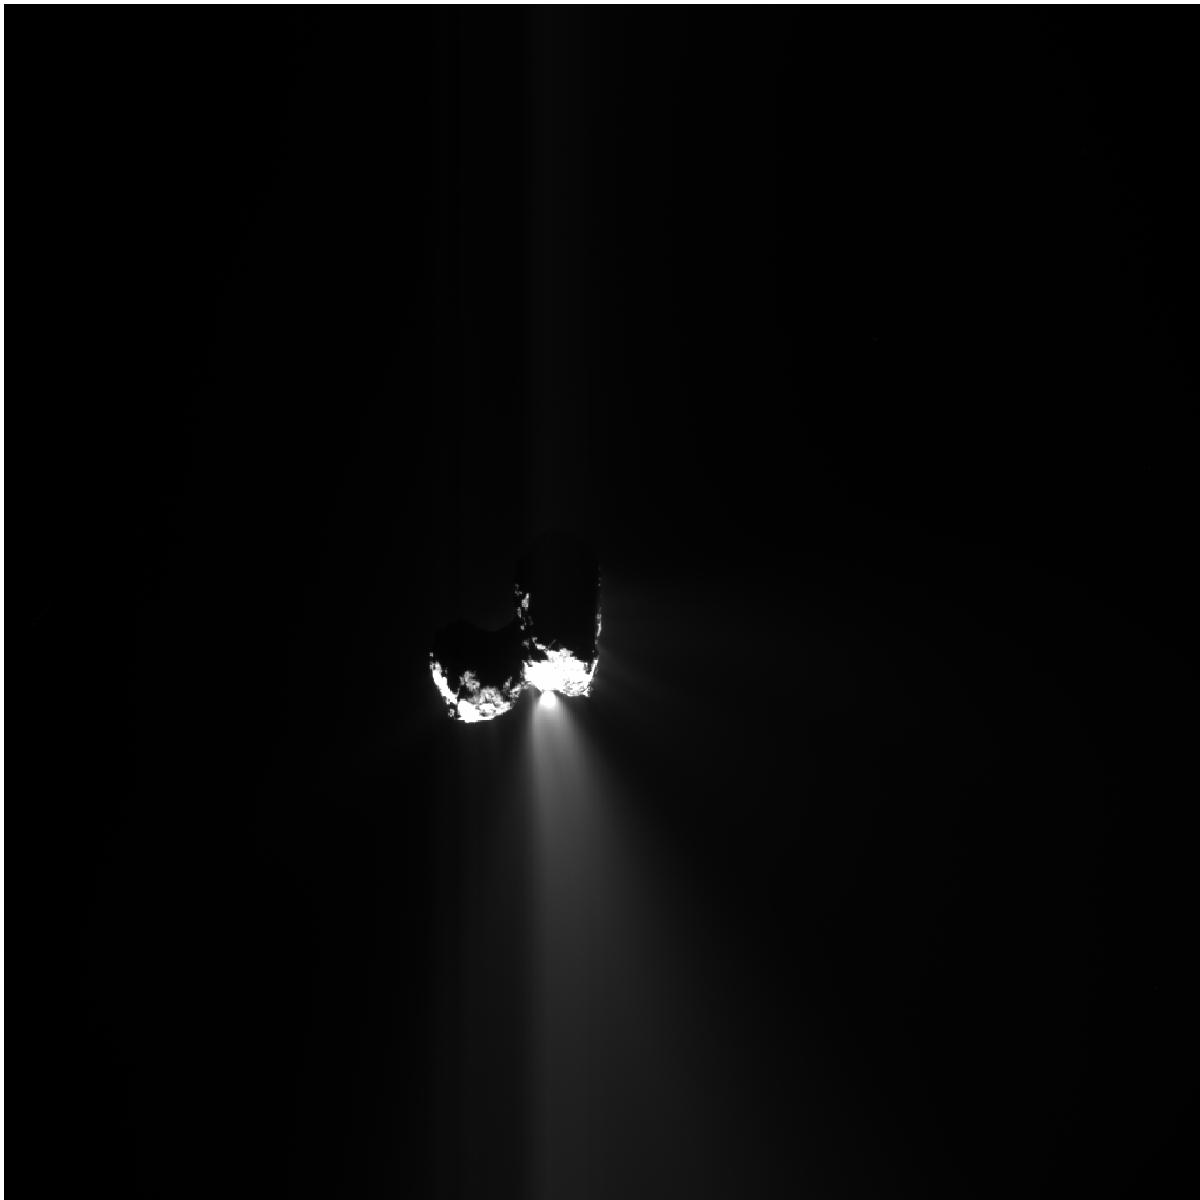
Outburst event captured by the NAVCAM on August 8, 2015 (ROS_CAM1_20150808T152148). The brightness is in linear scale. The estimated source region of this particular event lies around the transition between the Aker and Anhur regions.
Current usage metrics show cumulative count of Article Views (full-text article views including HTML views, PDF and ePub downloads, according to the available data) and Abstracts Views on Vision4Press platform.
Data correspond to usage on the plateform after 2015. The current usage metrics is available 48-96 hours after online publication and is updated daily on week days.
Initial download of the metrics may take a while.