Free Access
Fig. 14
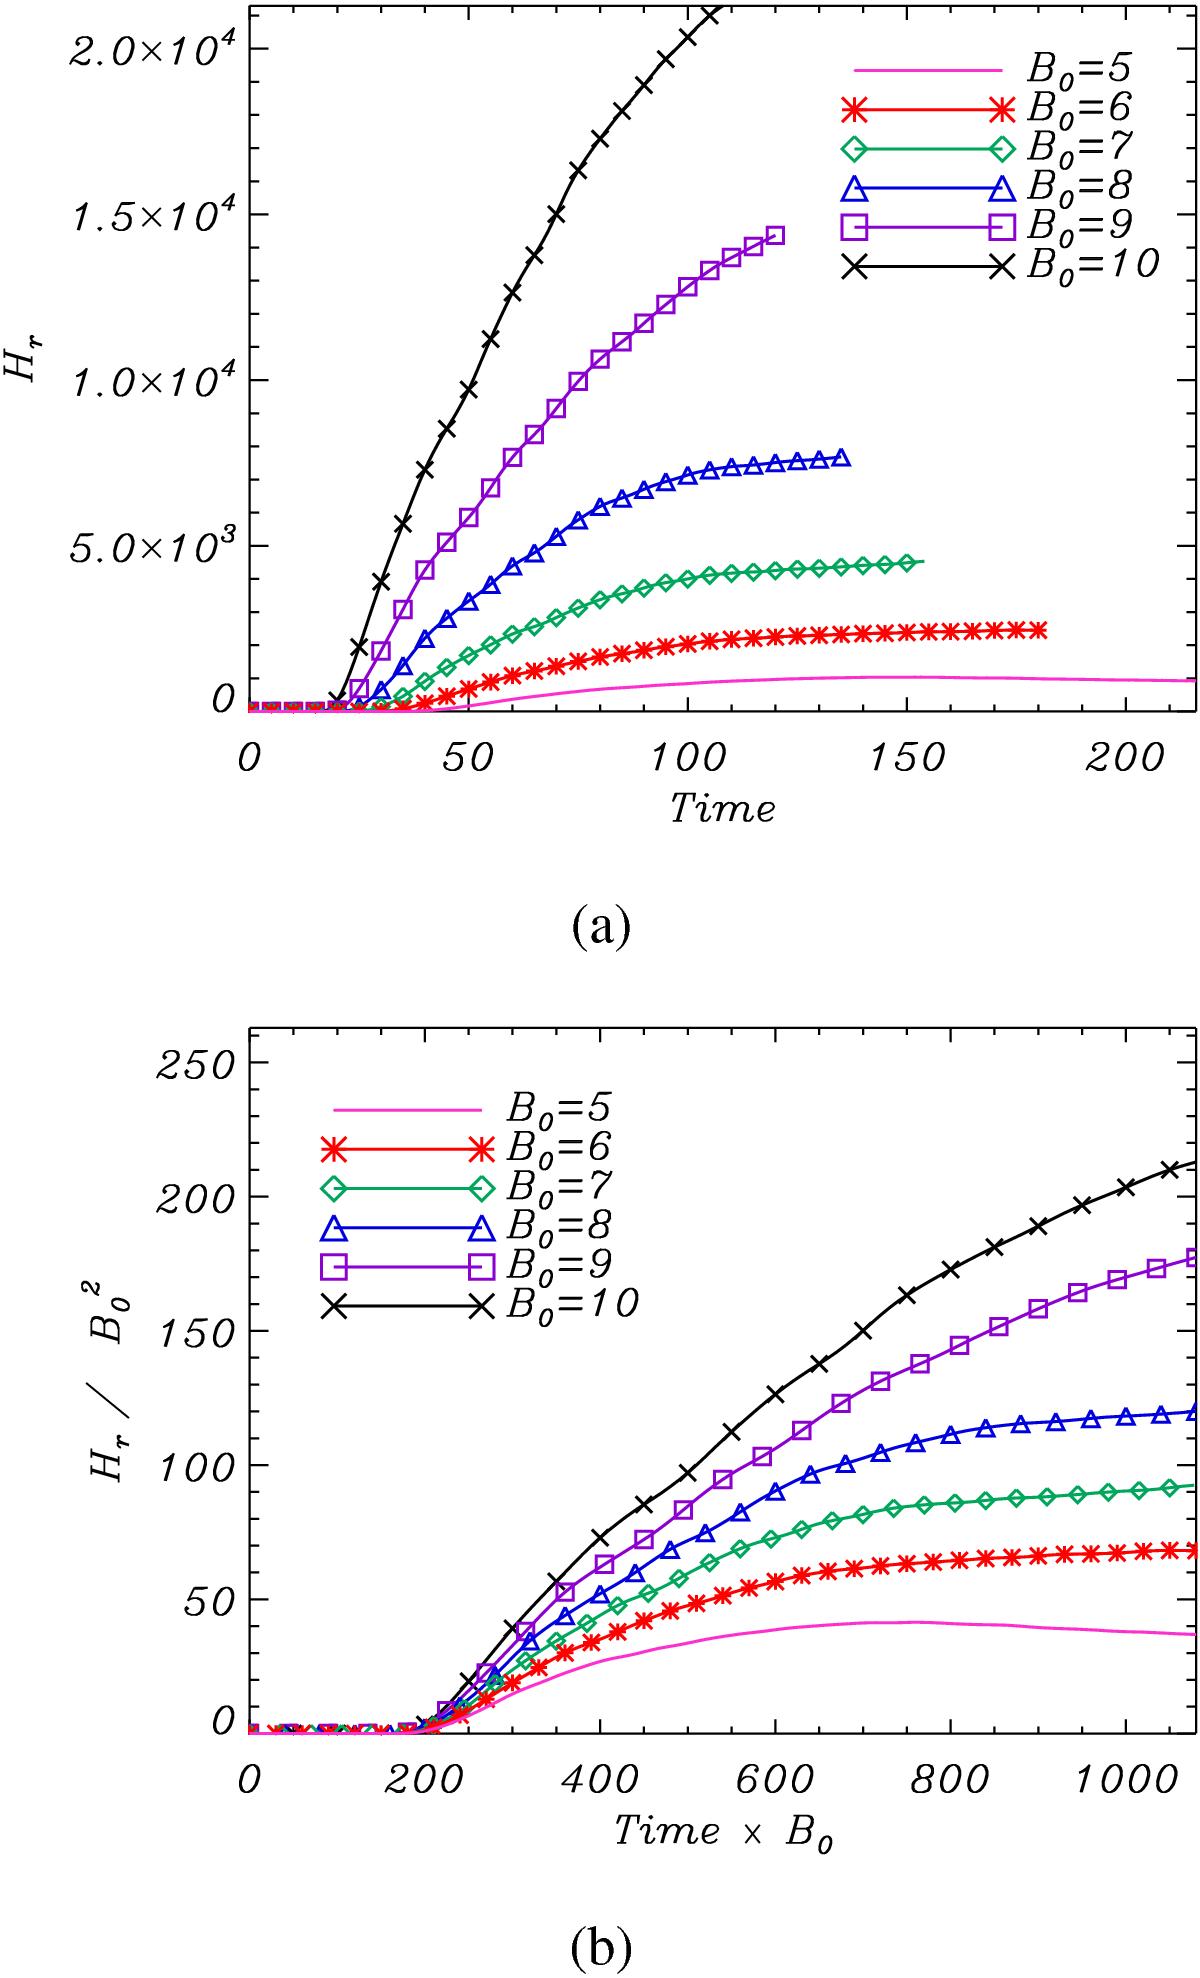
Relative magnetic helicity calculated within the atmospheric region z> 0 for various B0 cases. a) shows the unscaled helicity measured over time and b) details the rescaled magnetic helicity, ![]() , measured over rescaled time,
, measured over rescaled time, ![]() .
.
This figure is made of several images, please see below:
Current usage metrics show cumulative count of Article Views (full-text article views including HTML views, PDF and ePub downloads, according to the available data) and Abstracts Views on Vision4Press platform.
Data correspond to usage on the plateform after 2015. The current usage metrics is available 48-96 hours after online publication and is updated daily on week days.
Initial download of the metrics may take a while.