Fig. 8
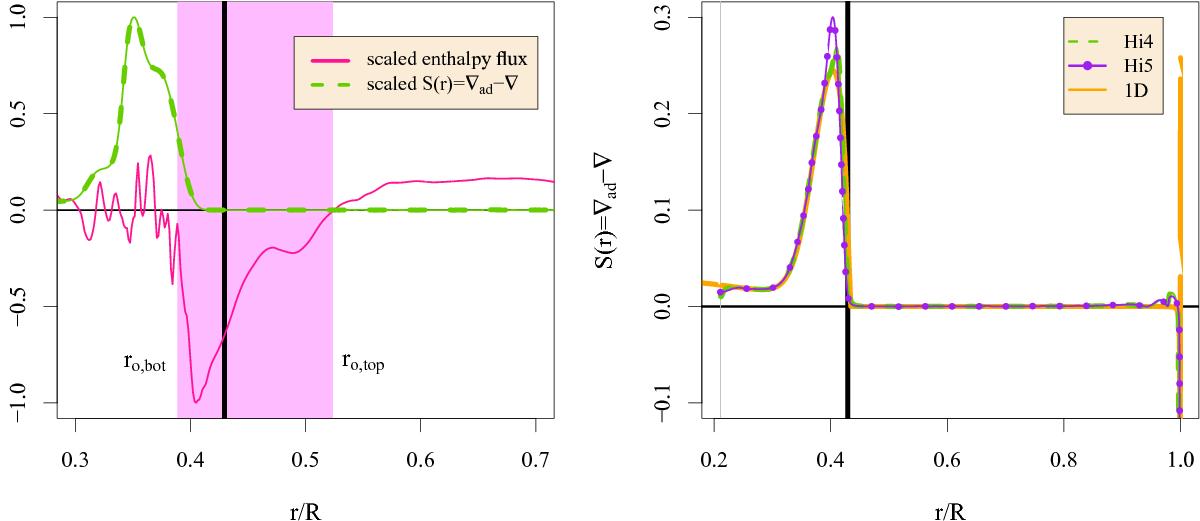
Left: overshooting layer in simulation Hi1 represented by the shaded area between the radii of ro,top and ro,bot. The heavy vertical line shows the position of the boundary between the radiative and convection zones, indicated by the entropy profile produced by the one-dimensional stellar evolution calculation. The full line shows the enthalpy flux, scaled by the magnitude of the large negative peak. The dashed line shows the Schwarzschild discriminant S(r), scaled to appear on this graph. Right: Schwarzschild discriminant in simulations Hi4 and Hi5, compared with the value obtained from the one-dimensional model of the young sun.
Current usage metrics show cumulative count of Article Views (full-text article views including HTML views, PDF and ePub downloads, according to the available data) and Abstracts Views on Vision4Press platform.
Data correspond to usage on the plateform after 2015. The current usage metrics is available 48-96 hours after online publication and is updated daily on week days.
Initial download of the metrics may take a while.