Fig. 7
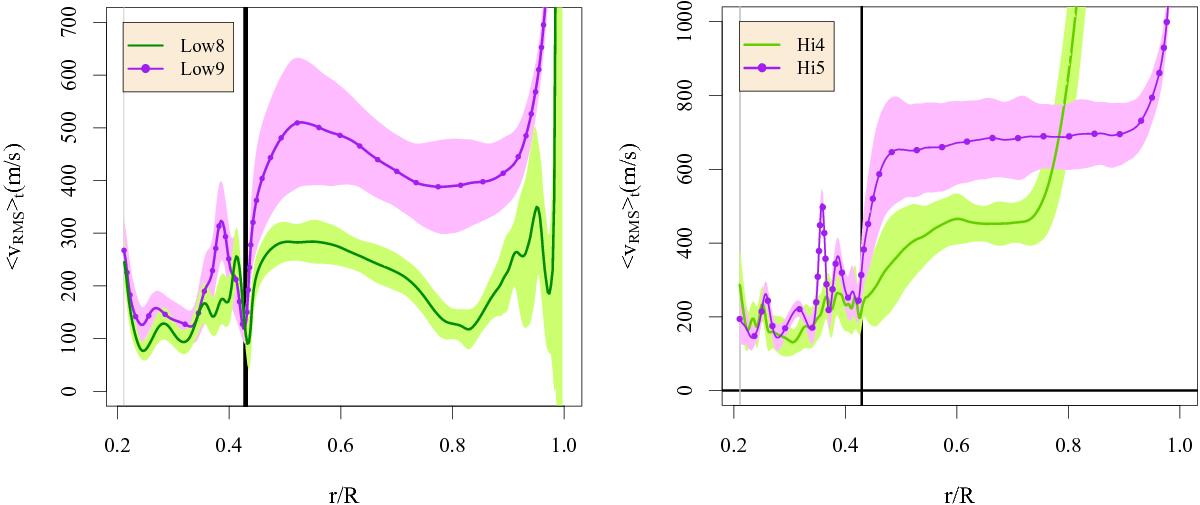
Time-averaged radial profile of rms velocity in simulations Low8 and Low9 (left) which include the near-surface layers up to the surface at r/R = 1.0, and simulations Hi4 and Hi5 (right). The shaded areas indicate one standard deviation above and below each time-averaged line. A heavy vertical black line marks the boundary between the radiative and convection zones, calculated from the radial profile of entropy and the Schwarzschild criterion. Gray vertical lines mark the inner radial boundary of the spherical-shell simulation volume for each simulation shown.
Current usage metrics show cumulative count of Article Views (full-text article views including HTML views, PDF and ePub downloads, according to the available data) and Abstracts Views on Vision4Press platform.
Data correspond to usage on the plateform after 2015. The current usage metrics is available 48-96 hours after online publication and is updated daily on week days.
Initial download of the metrics may take a while.