Fig. 5
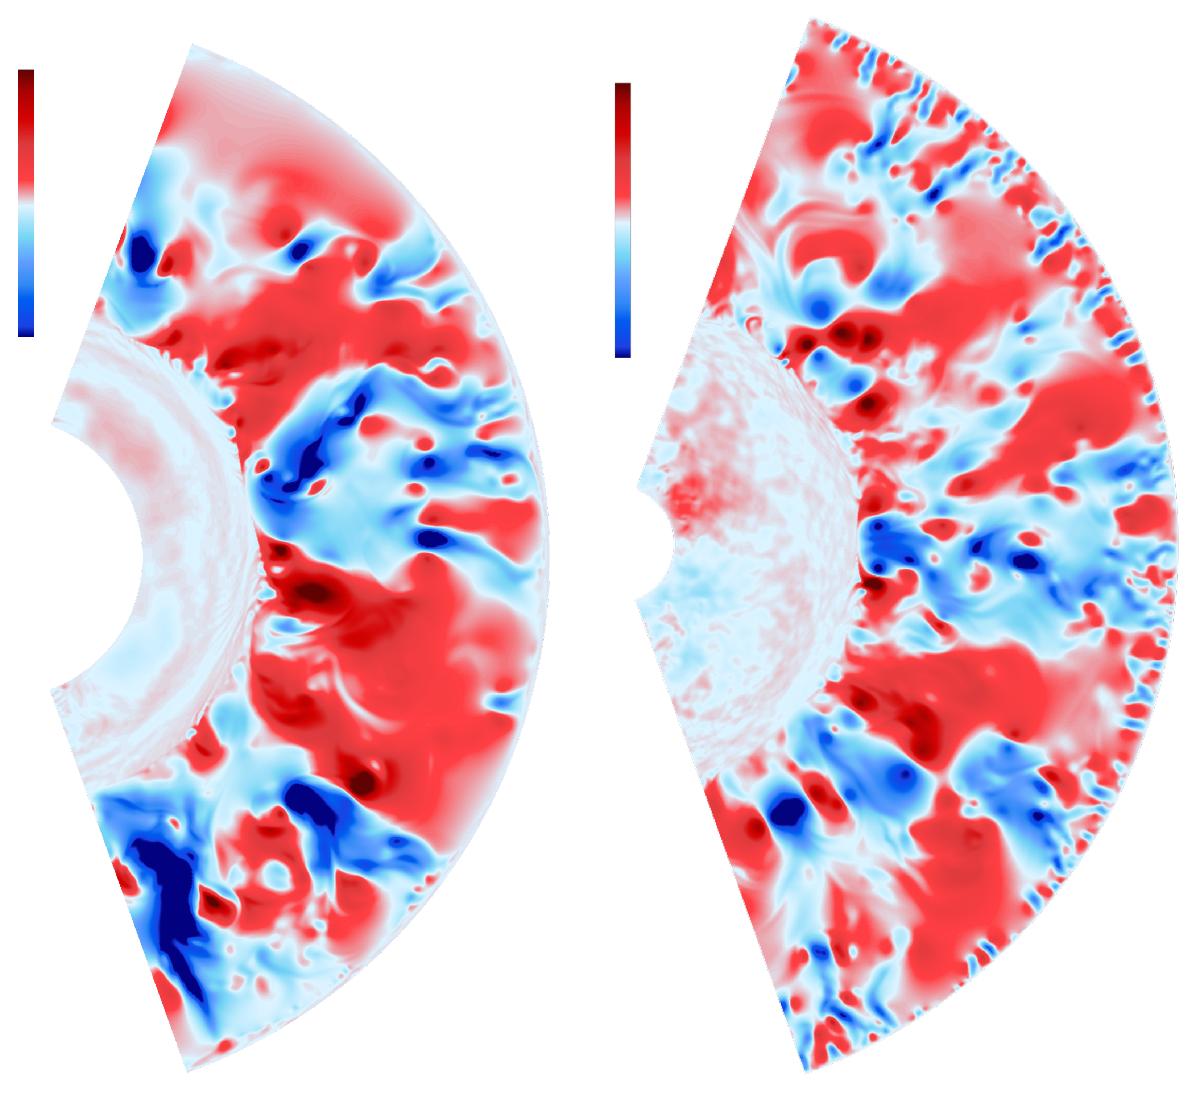
Instantaneous radial velocity in simulations of the young sun. The left panel shows a typical snapshot from simulation Hi1, which excludes the near-surface layers and the lower radiative zone. The right panel is typical of simulation Hi2, which includes a large extent of the radiative zone. Small-scale convective motions are clearly visible in the near-surface layers of simulation Hi2. These simulations have identical temperature and density profiles, grid spacing, and boundary conditions. They are both visualized during steady convection. The sole difference is the position of the simulation boundaries in the radial direction. The color schemes are identical: blue indicates an inward flow, while red indicates an outward flow.


Current usage metrics show cumulative count of Article Views (full-text article views including HTML views, PDF and ePub downloads, according to the available data) and Abstracts Views on Vision4Press platform.
Data correspond to usage on the plateform after 2015. The current usage metrics is available 48-96 hours after online publication and is updated daily on week days.
Initial download of the metrics may take a while.