Fig. 4
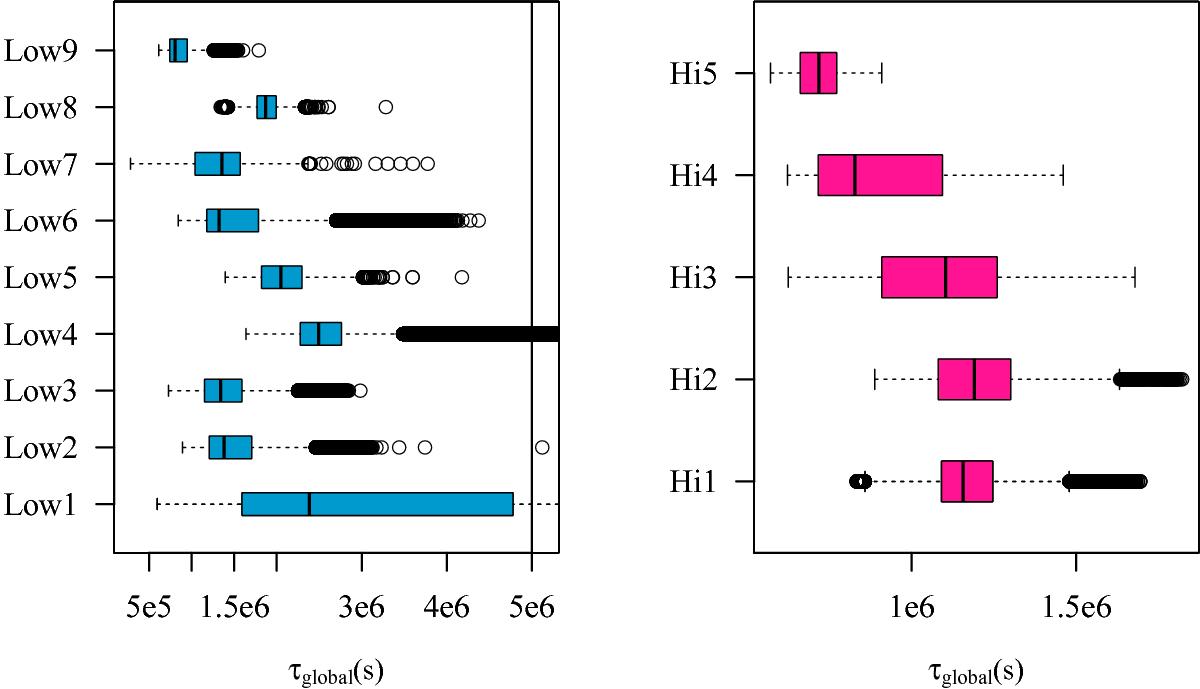
Standard Tukey box plot of the global time scale τglobal sampled at a fixed time interval throughout the simulations (left) Low1-9 and (right) Hi1-5. A box plot (e.g. Spitzer et al. 2014; McGill et al. 1978) is designed to show characteristics of the spread of the data. The line in the middle of the box is the median. The box itself represents the middle 50% of the data, so that the edges are the 25th and 75th percentiles. The whiskers, i.e. error bars, represent the extent of the data when outliers are discounted. Outliers are represented by circles. For a Tukey box plot, outliers are defined as data that lie farther than 1.5 times the interquartile range from the box. The vertical black line at 5 × 10⁶ s marks the value of τconv that we obtain from mixing length theory.
Current usage metrics show cumulative count of Article Views (full-text article views including HTML views, PDF and ePub downloads, according to the available data) and Abstracts Views on Vision4Press platform.
Data correspond to usage on the plateform after 2015. The current usage metrics is available 48-96 hours after online publication and is updated daily on week days.
Initial download of the metrics may take a while.