Fig. 3
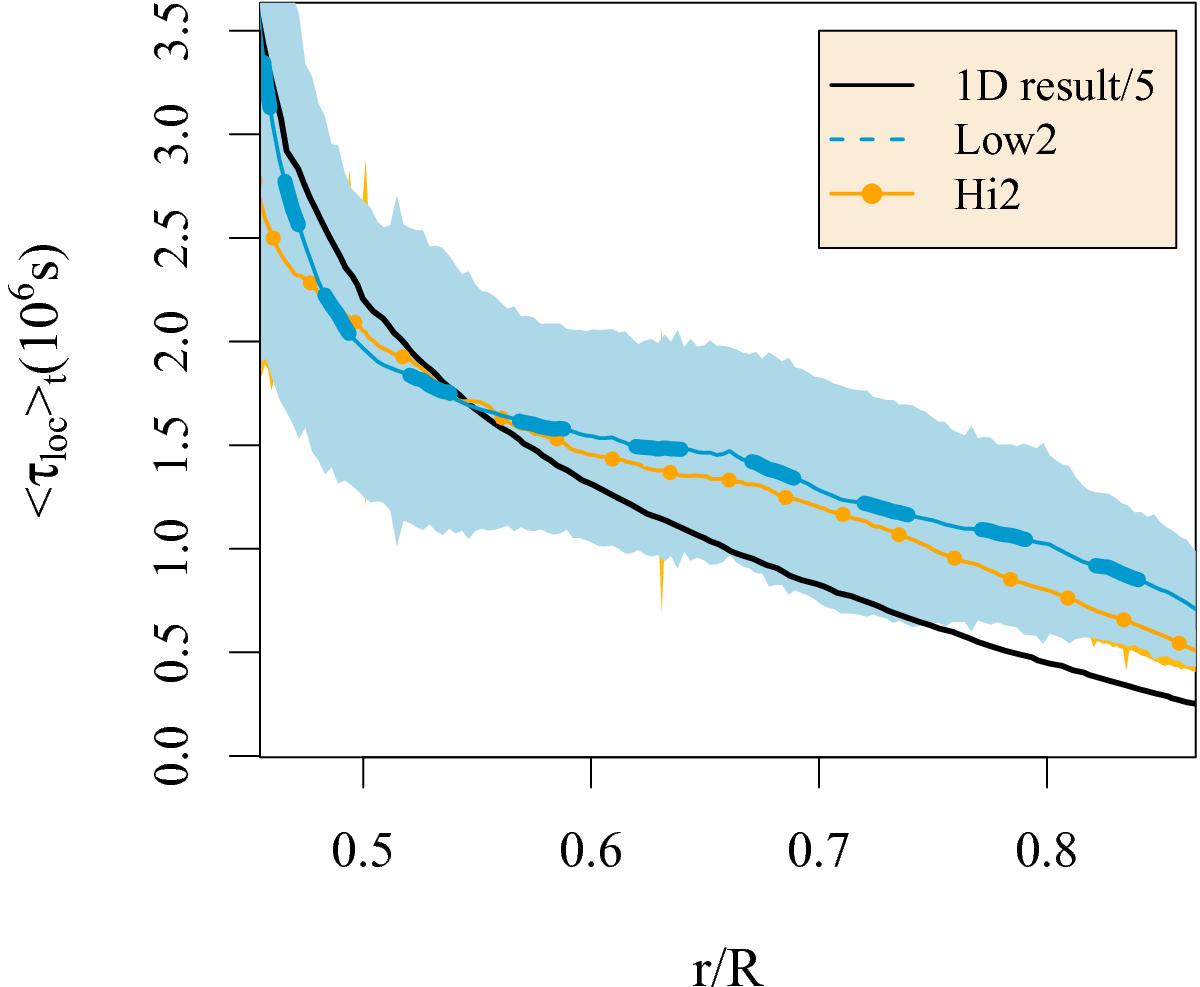
Radial profiles of the local convective turnover time ⟨ τloc ⟩ t averaged over the full simulation time in simulations Low2 and Hi2, compared with the value obtained from the one-dimensional Lyon stellar evolution code after dividing by a factor of 5. The shaded areas indicate one standard deviation above and below each of these time-averaged lines; the shaded areas are nearly identical for these two simulations.
Current usage metrics show cumulative count of Article Views (full-text article views including HTML views, PDF and ePub downloads, according to the available data) and Abstracts Views on Vision4Press platform.
Data correspond to usage on the plateform after 2015. The current usage metrics is available 48-96 hours after online publication and is updated daily on week days.
Initial download of the metrics may take a while.