Fig. 5
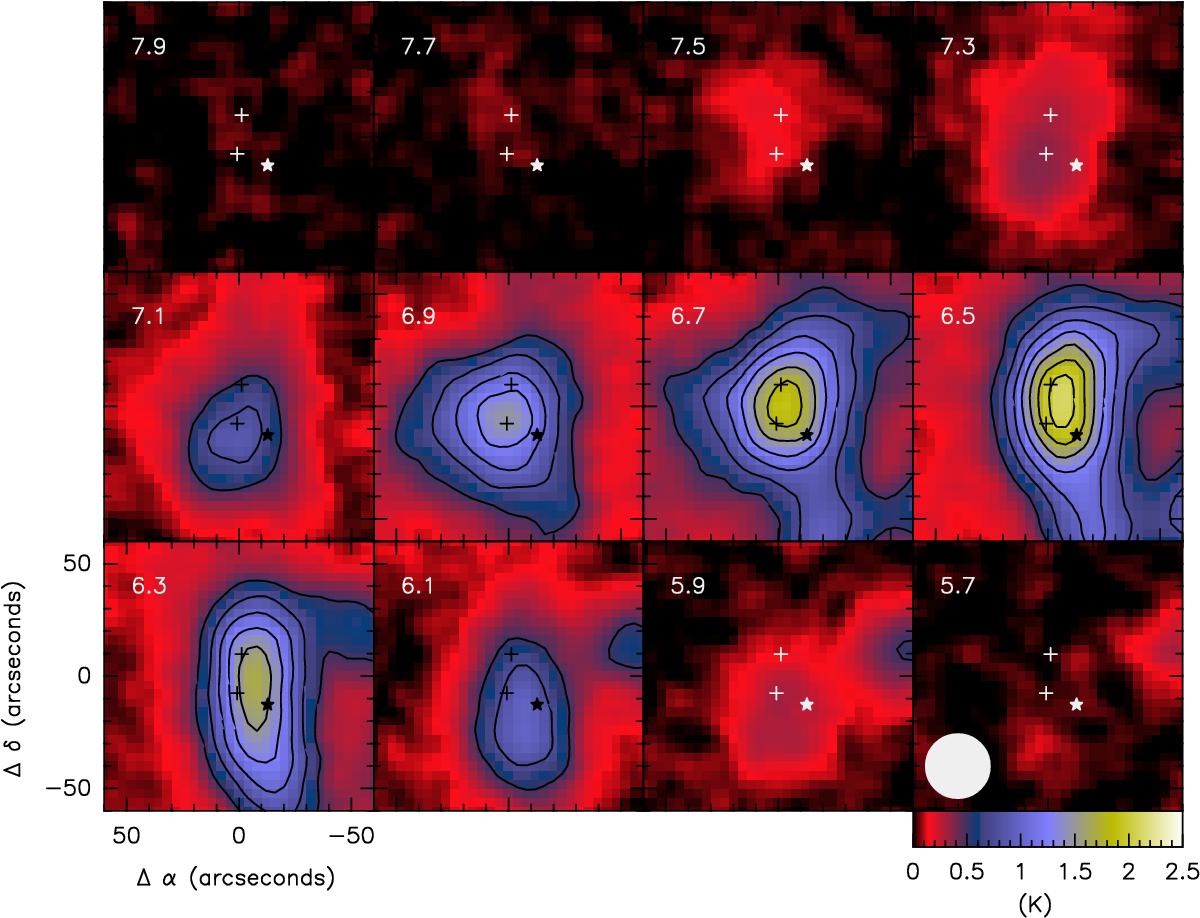
Spectral maps of the SO 22 → 11 line as observed with the IRAM 30-m telescope. The central velocity is indicated in the top-left corner. Contours are 0.5 K to 4.5 K by steps of 0.25 K. The crosses indicate the positions of the protostellar cores B1b-N and B1b-S. The star denotes the position of B1b-W. In the last panel we plot the beam at 86.094 GHz.
Current usage metrics show cumulative count of Article Views (full-text article views including HTML views, PDF and ePub downloads, according to the available data) and Abstracts Views on Vision4Press platform.
Data correspond to usage on the plateform after 2015. The current usage metrics is available 48-96 hours after online publication and is updated daily on week days.
Initial download of the metrics may take a while.