Fig. 2
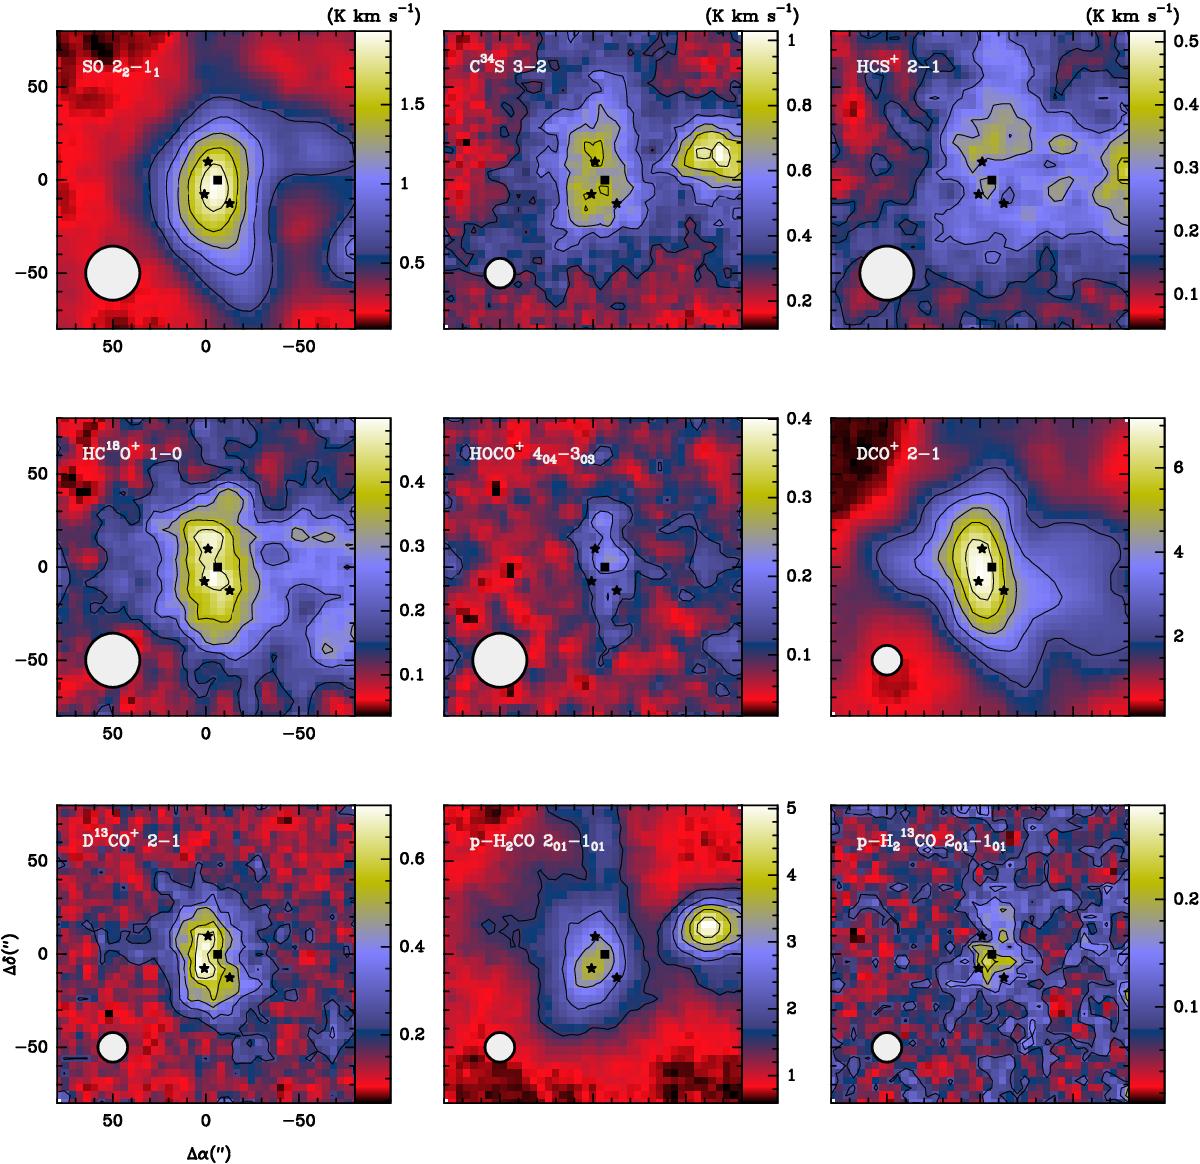
Integrated intensity maps of the SO 22 → 11, C34S 3→2, HCS+ 2→1, HC18O+ 1→0, HOCO+ 404 → 303, DCO+2 → 1, D13CO+2 → 1, p-H2CO 202 → 201, and p-H![]() CO 202 → 201 lines. The HPBW of the 30-m telescope at each line frequency is drawn in the bottom-left corner of the panel. The stars indicate the positions of B1b-N, B1b-S and B1b-W. The black square shows the position targeted in the unbiased spectral survey.
CO 202 → 201 lines. The HPBW of the 30-m telescope at each line frequency is drawn in the bottom-left corner of the panel. The stars indicate the positions of B1b-N, B1b-S and B1b-W. The black square shows the position targeted in the unbiased spectral survey.
Current usage metrics show cumulative count of Article Views (full-text article views including HTML views, PDF and ePub downloads, according to the available data) and Abstracts Views on Vision4Press platform.
Data correspond to usage on the plateform after 2015. The current usage metrics is available 48-96 hours after online publication and is updated daily on week days.
Initial download of the metrics may take a while.