Fig. B.2
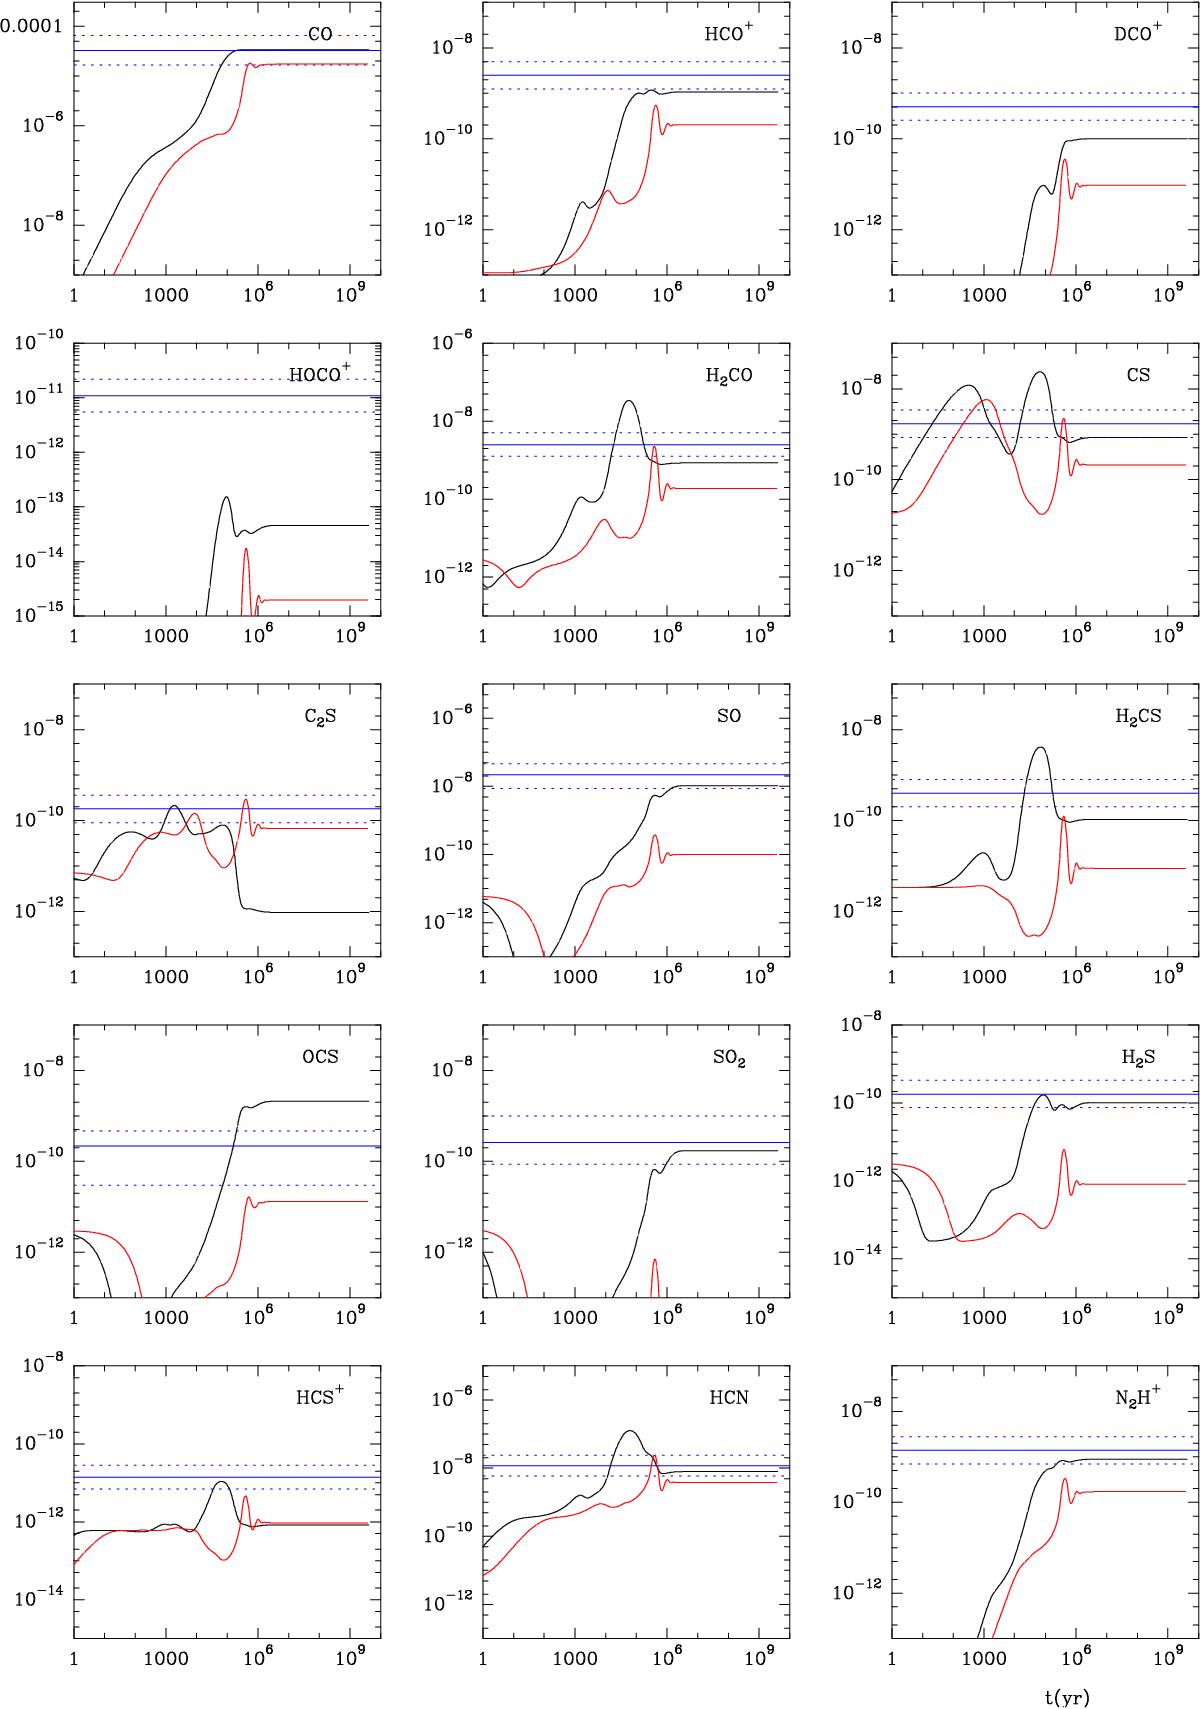
Results of our best-fit model (ζH2 = 4.0 × 10⁻¹⁷ s-1, O/H = 3.0 × 10⁻⁵, N/H = 6.4 × 10⁻⁵, C/H = 1.7 × 10⁻⁵, and S/H = 6.0 × 10⁻⁷). We assume a density of n(H2) = 105 cm-3 and Tk = 12 K. The thick and dashed blue lines indicate the observed values and their uncertainty, which are considered to be a factor of 2 for most molecules (see text), respectively. In the case of SO, SO2, and OCS, their abundances change by more than a factor of 2 between the 6.5 km s-1 and 7.0 km s-1 velocity components. In the panels corresponding to these species, the dashed lines indicate the abundance for each component separately. In red we show model calculations for the same conditions and n(H2) = 104 cm-3.
Current usage metrics show cumulative count of Article Views (full-text article views including HTML views, PDF and ePub downloads, according to the available data) and Abstracts Views on Vision4Press platform.
Data correspond to usage on the plateform after 2015. The current usage metrics is available 48-96 hours after online publication and is updated daily on week days.
Initial download of the metrics may take a while.